Also see: GE Portable Induction Test Meter Type 1B5Y (forcalibrating electric meters) & Sangamo Electric Meter
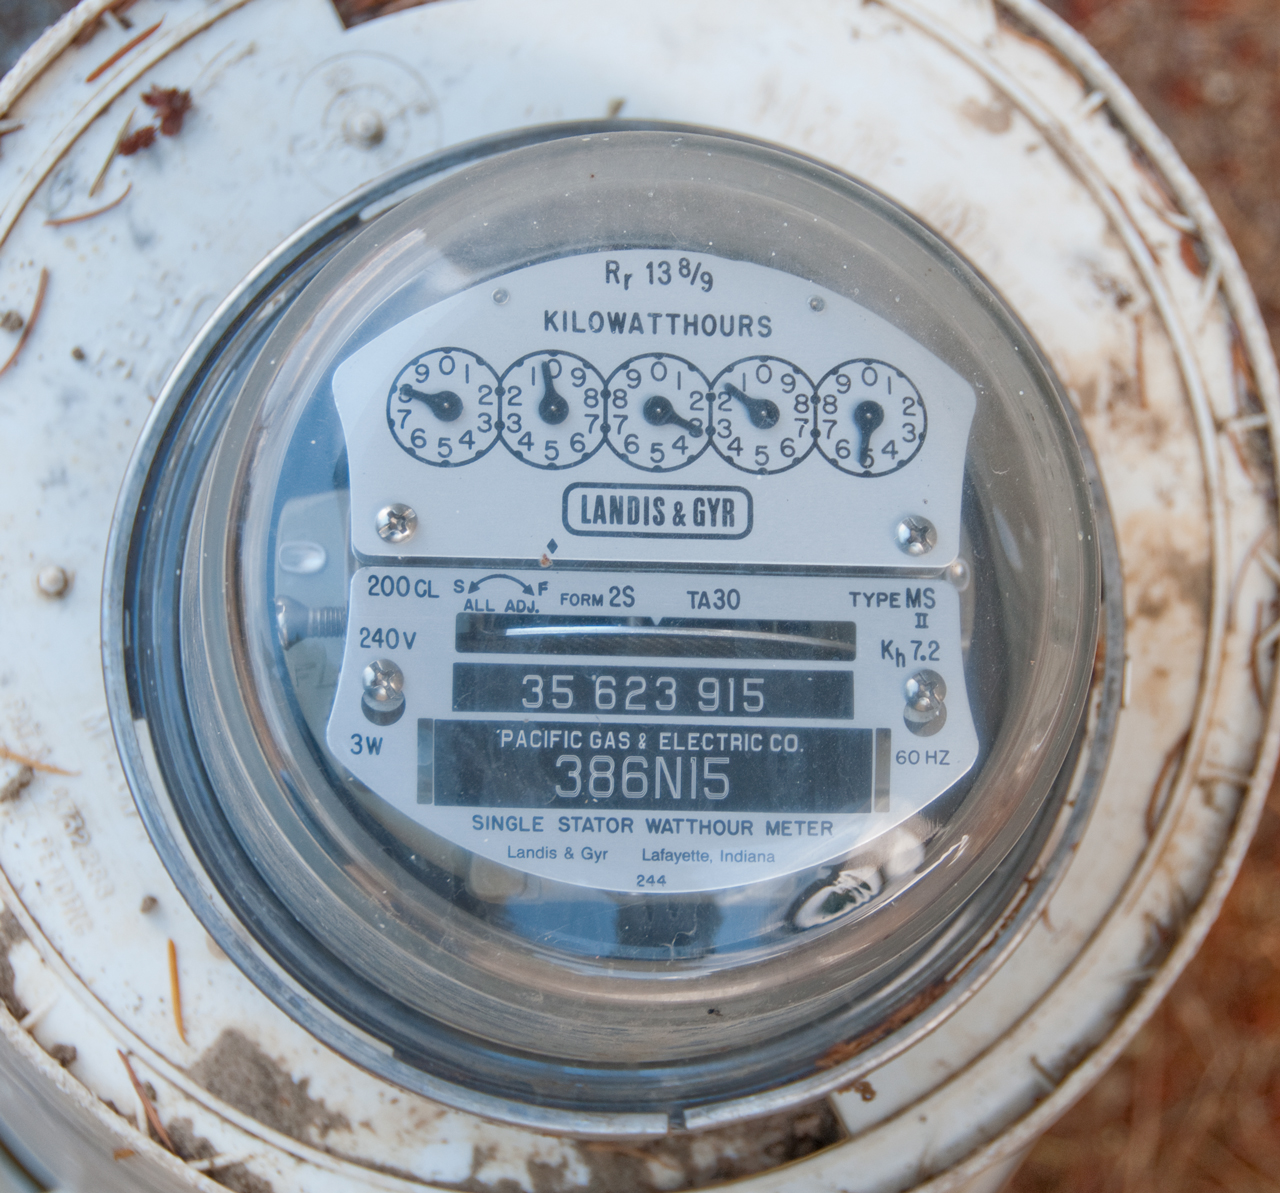
Analog Electric Meter - Single Stator Watt-hour Meter
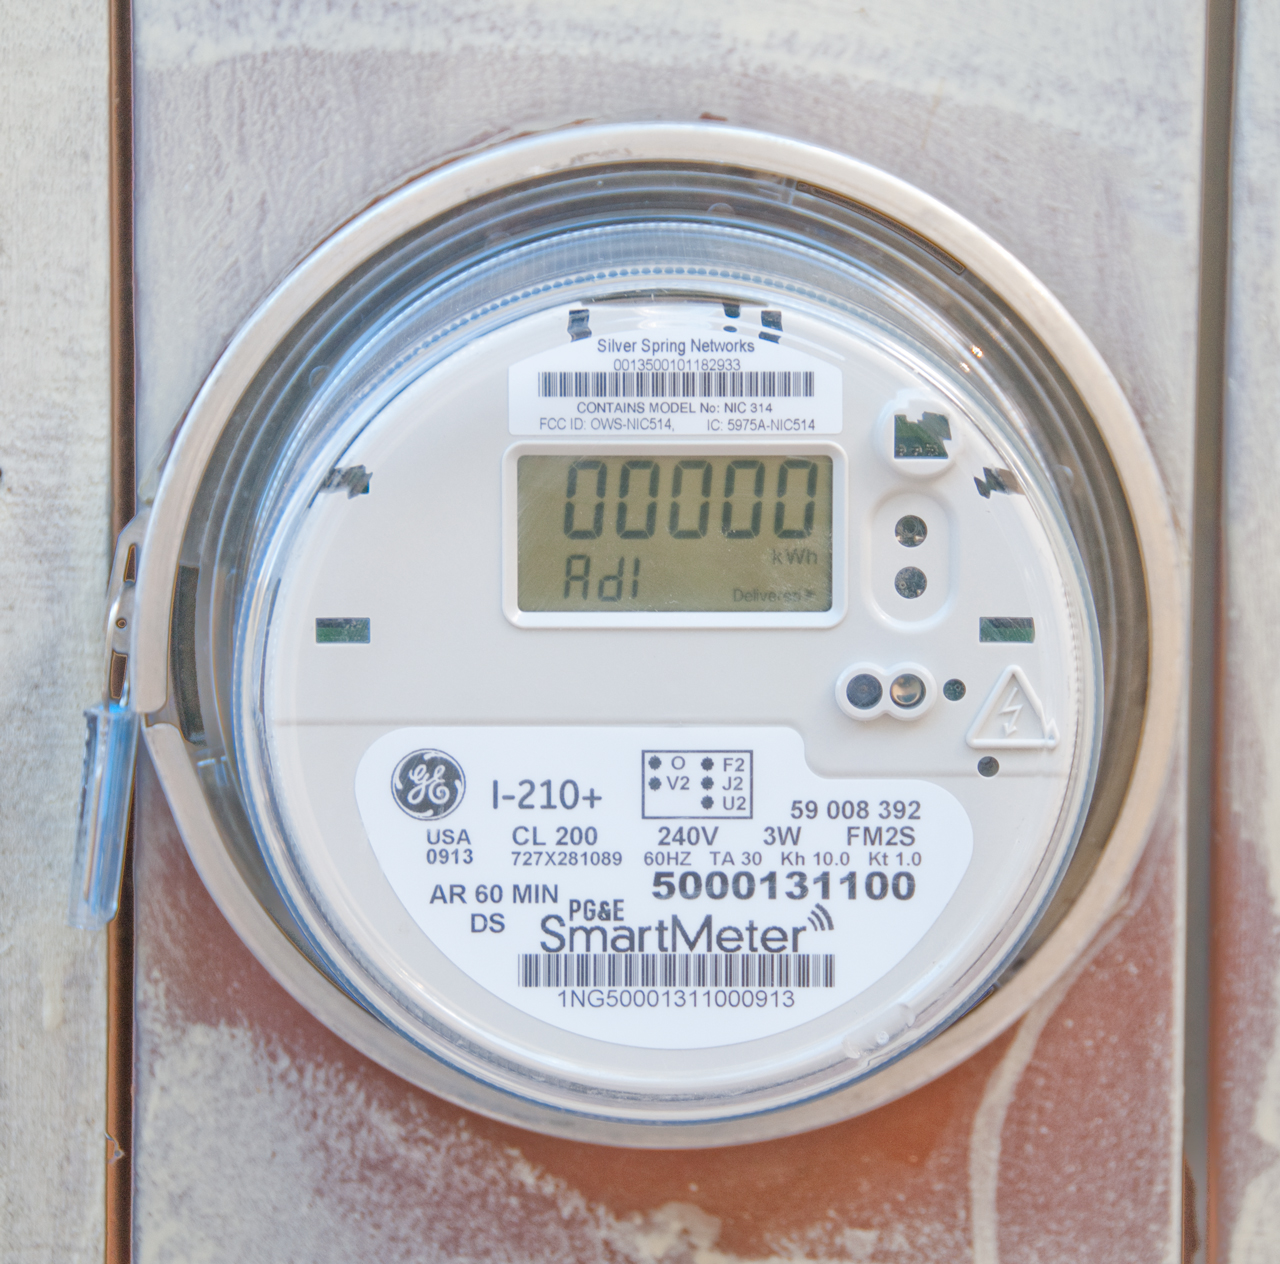
Digital Electric Meter
17 Dec 2013 -Got this email from PG&E today, in response to my query to see why I could not see any on line indication that there was a smart meter here.
"We sincerely apologize; however, at this time your meter is not being read remotely. Pacific Gas and Electric Company will establish a remote connection with your meter once the SmartMeter Network is in place. This usually takes 60 to 90 days. Keep your eyes open for communications from Pacific Gas and Electric Company that will help you take advantage of this new technology."
I thought they would not install a Smartmeter if there was no way for it to communicate in the direction of downtown, but they did. I'm guessing that once they've installed a bunch of them the next step will to make a connection diagram, i.e. have a computer in a vehicle drive around and query meters and see what other meters they can talk to. This would be needed to determine how many and where to install pole mounted units to allow all the meters in this area to communicate with the rest of the system.
I'm guessing that the guy who used to read my meter manually now can just drive down the street and probably not even slow down to read the meter.
meter reads: 1178. Last month usage was 652 kWh, but that last couple of weeks has been the coldest in the past 20 years. There is snow on the ground that's over a week old, that's never happened before.
Installed 16 Nov 2013 (Saturday). If I refused the installation there would be a one time charge like $50 and a monthly charge of $10.
The SmartMeters have a wireless module, typically made by Silver Springs Networks (Wiki), that receives and transmits in both the:
902 to 928 MHz ISM band (peak power out 1.5 to 2.5 Watts) and in the (for meter to meter mesh networks)
2.40 to 2.45 GHz Wifi band (peak power out about 0.1 to 0.2 Watts). (for the HAN mesh network)
Note both these bands are in the Industrial, Scientific & Medical (ISM) frequency allocations (Wiki).
My guess is that the Wifi is to support both the Home Area Network (Wiki).
It's not clear which frequency my meter is using. As far as I can tell the meter transmits once each 15 minutes and with a duty cycle that's way below 1 percent so it's not an easy thing to catch it transmitting.
Installation by Wellington Energy (see their web page for the hand held optical interface test set).
If you know the name of the test set let me know. It's something like TruGPSE01
26 Dec 2013 - A technician came to confirm that the meter was provisioned correctly. He said they are doing that to some percent of all Smartmeters that were installed, but it also may be related to my asking PG&E why it wasn't working.
It's possible that the WiFi radio is for ZigBee (Wiki). If that's the case it would be for the HAN.
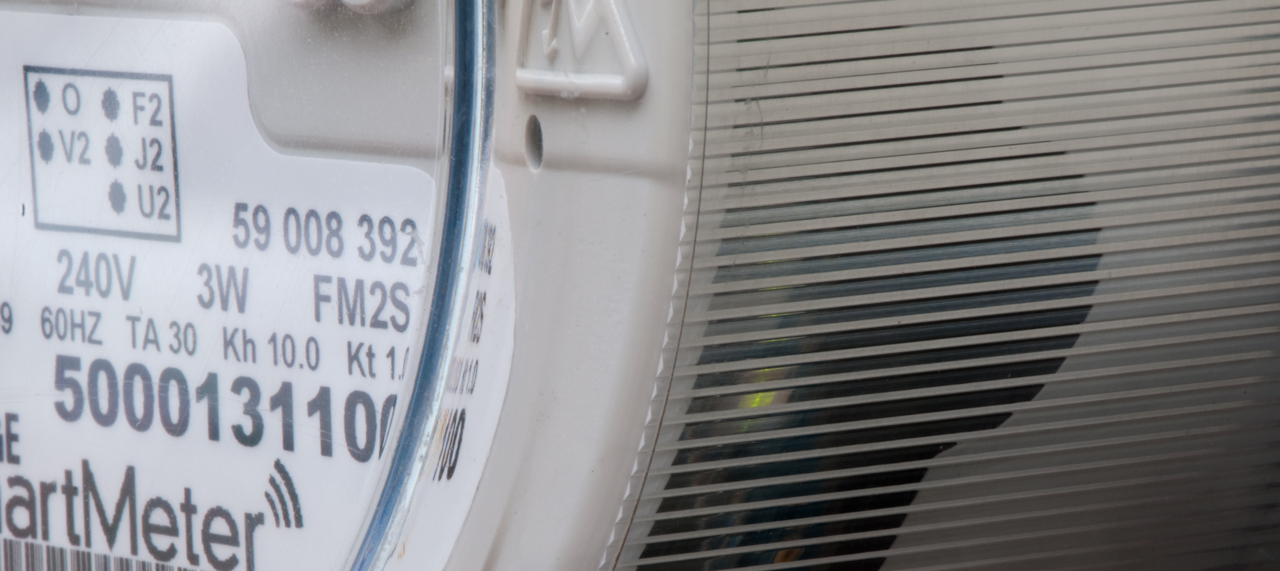
The technician who installed the smart meter had a hand holdable test instrument on his tool belt. It had two cylindrical protrusions which I'm guessing are an ANSI C12.18 Type 2 Optical Port. (Fig 4)
This my works with the two horizontal dots just below the lower right corner of the LCD. The left (darker) is the IR LED and the right (clear) one is the photo transistor
One IR LED pulse for each Kt (1.0 Wh in this case) in calibration mode. Each pulse is about 25 ms wide.
The PG&E My Energy page is not updated to show any SmartMeter data until a full billing cycle after the installation (about 30 days).
Fig 1 Analog meter just after being removed.
Total reading since house was built: 80215 kWh
Year of construction about 1992 or about 3800 kWh per year
or about 300 kWh per month.
The appearance of an analog electric meter is the same when the power is off and when the power is on if there is no load or a small load. That's to say if the disk is moving very slowly it would be hard to tell if PG7E was on or off.
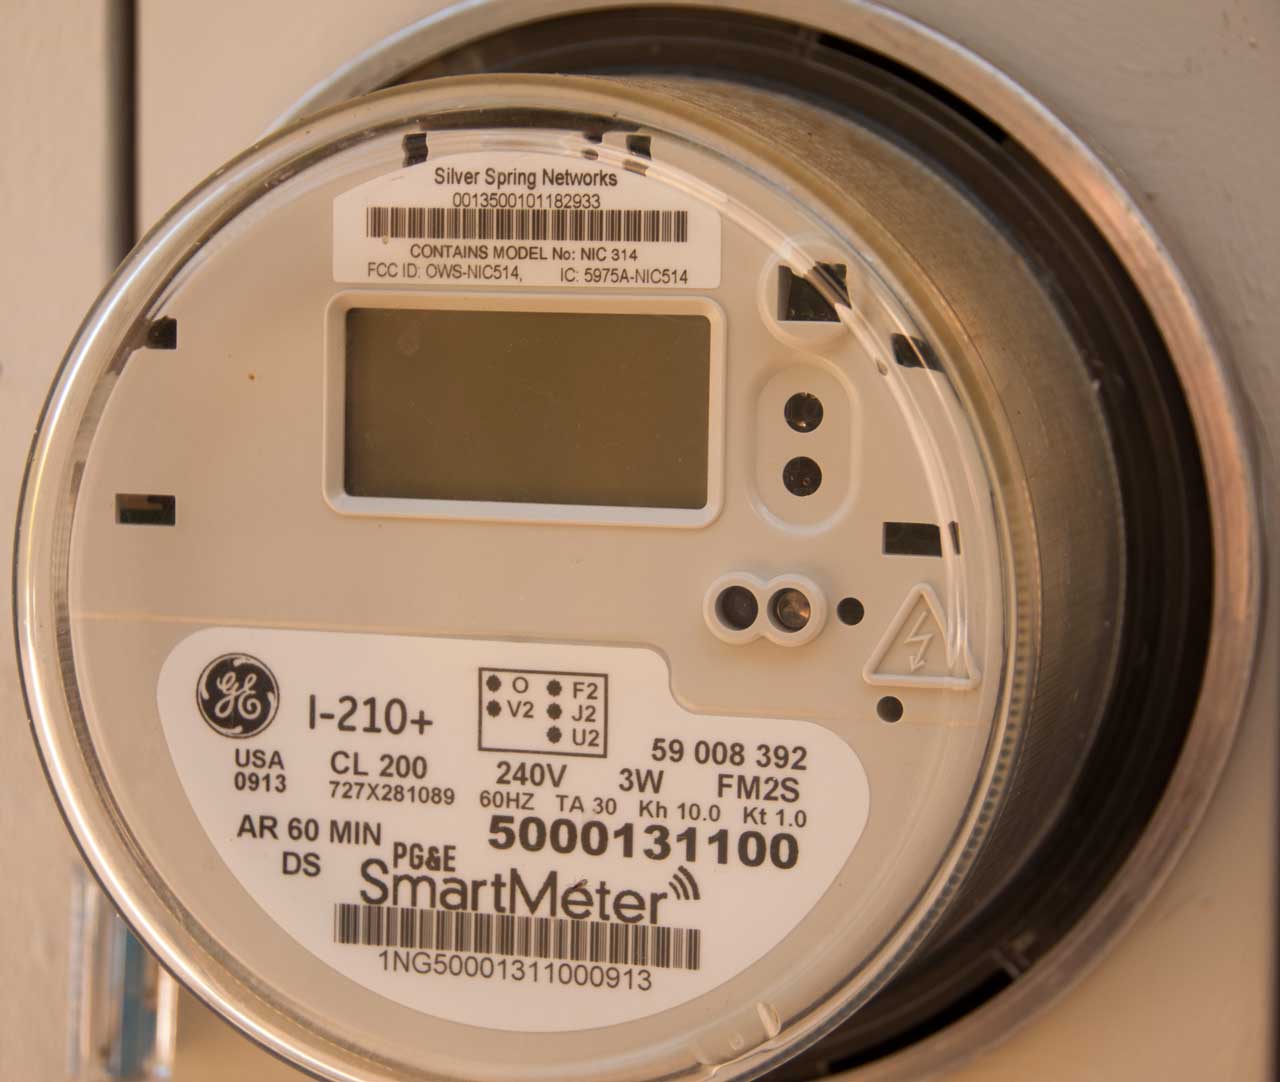
Fig 2 Smart electric meter just after being installed
Model: GE I-210+
Wireless: Silver Springs Networks NIC 314 (Wiki)
mfg date 09/13
CL 200 -> 200 Amps
240 VAC
3W -> 3 Wire
ANSI C12.10 Form No. FJ2S
TA30 -> Test at 30 Amps
Test constant (Kt) 1.0 Watt hour
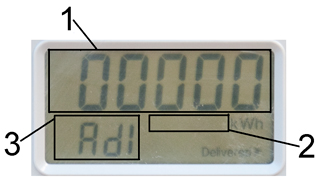
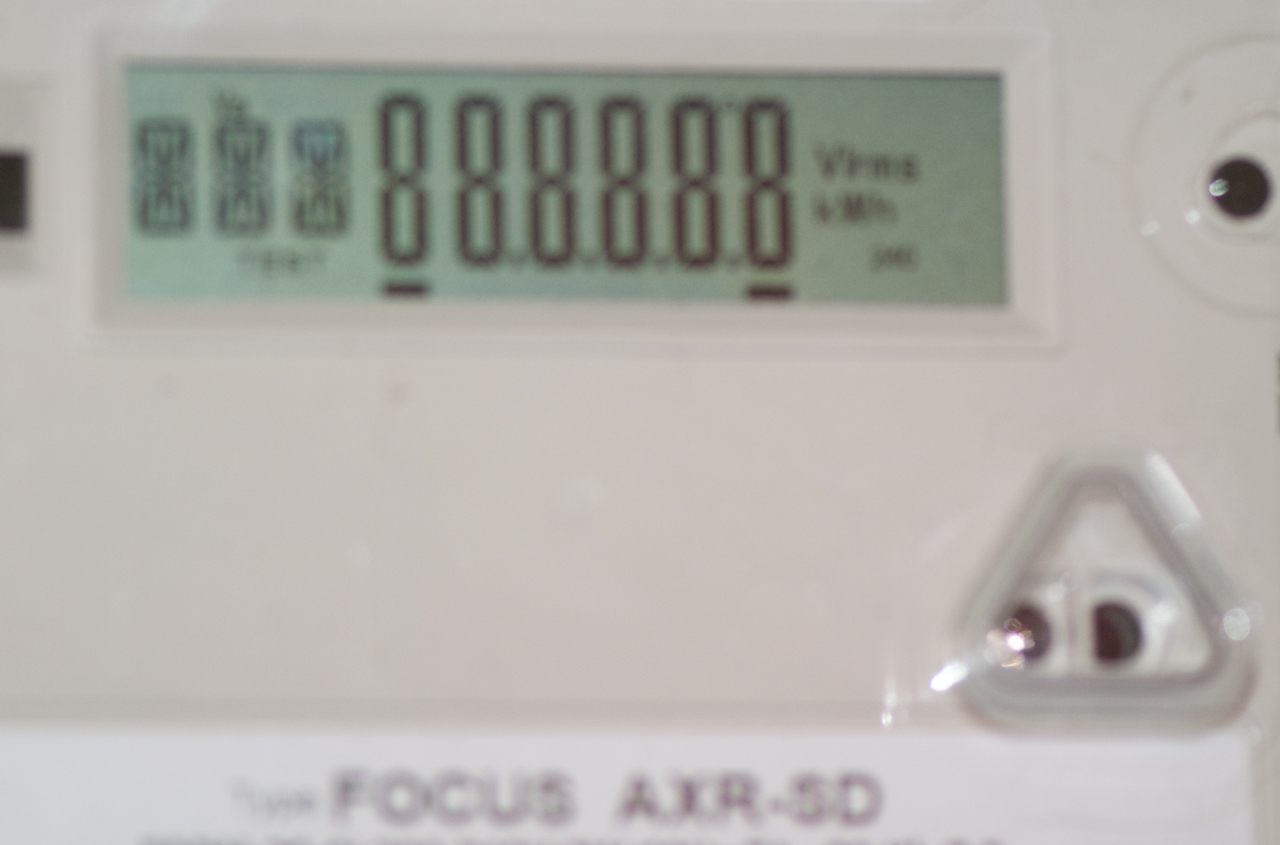
Fig 3 LCD
1 Main kWh display cycles between:
segment check: -88888 and the
kWh total.
"ERROR" will alternate with the kWh total if there's a problem
2 Watt hour disk emulator - use stopwatch to time between
--- and then ---.
Wh = Kh (10.0 Wh) * Number of rotations
3 subsidiary display cycles through:
247 Volts (voltage of mains feed 240 is nominal)
on (maybe shows off if you don't pay your bill)
Ad1 (maybe showing rate structure)
2.28 kW showing current energy usage
I expect the area 3 display will change when the meter has
been programmed to other electric rate schedules or
if time of use billing is implemented.
Note: There is NO clock shown now.
PG&E: Reading the SmartMeter
The lower right "Delivered ->" shows energy direction
Fig 4 Video of LCD display cycle
The flickering may be caused by the Terralux flashlight since it does not show up in other videos.
Fig 5 Green LED blinking on right side
Fig 6 PG&E power shut down, LCD is blank
This is important to know when to turn of generator and reconnect house to PG&E.
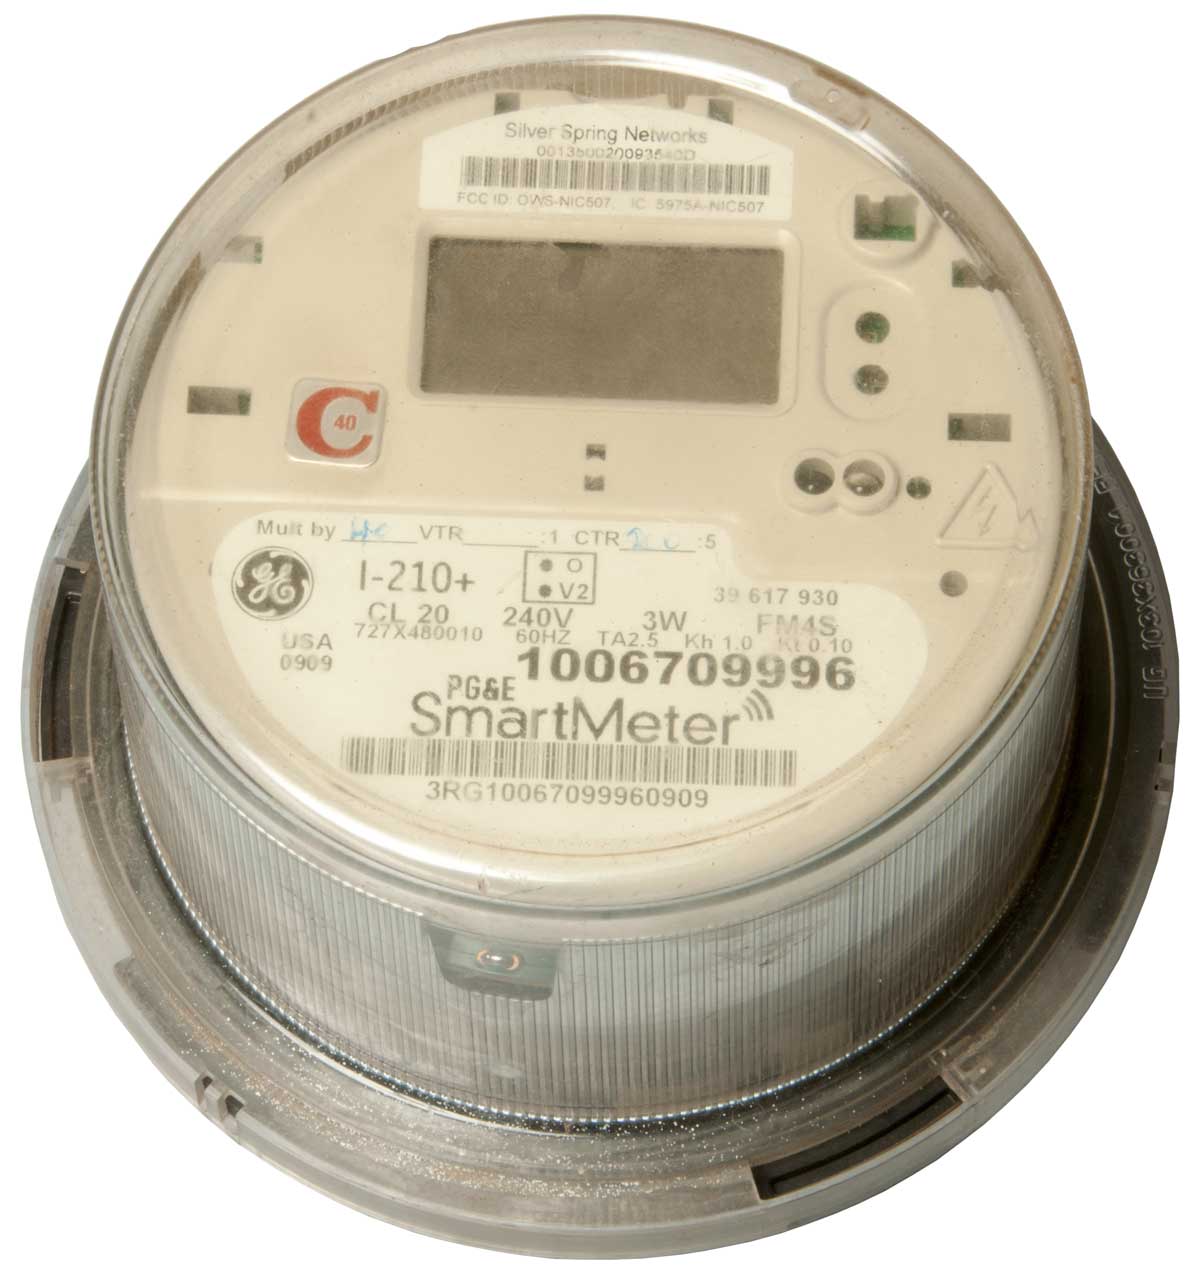
Fig 1 the second smart electric meter |
The first smart electric meter was
installed Sep 2013, so lasted just over 8 years. |
Two Tier Smart Electric Meter
This is not my meter, but belongs to a friend. It's setup for Time Of Use metering.
Landis Gyr (Wiki) (Now owned by Toshiba) model: Focus AXR SD
Fig 1 Line Voltage
I expect that the triangle with two dots is the
ANSI C12.18 Type 2 Optical Port.
Fig 2 TOU 01 total kWh
Fig 3 TOU 02 total kWh
Fig 4 "CLS" Clear Screen?
Fig 5 *** All LCD segments on
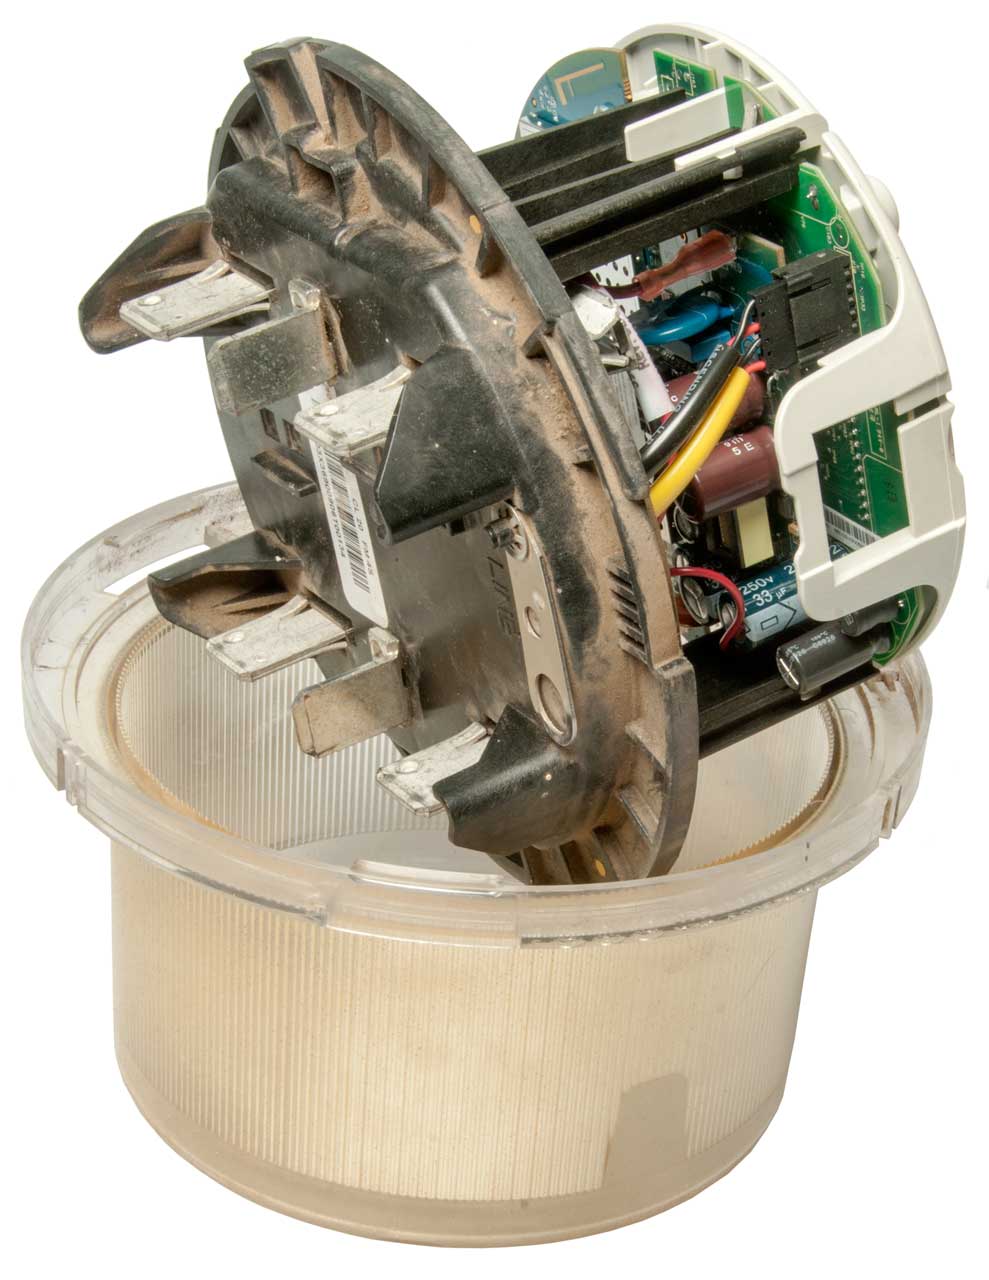
Inside a PG&E SmartMeter
Got a PG&E SmartMeter on eBay.
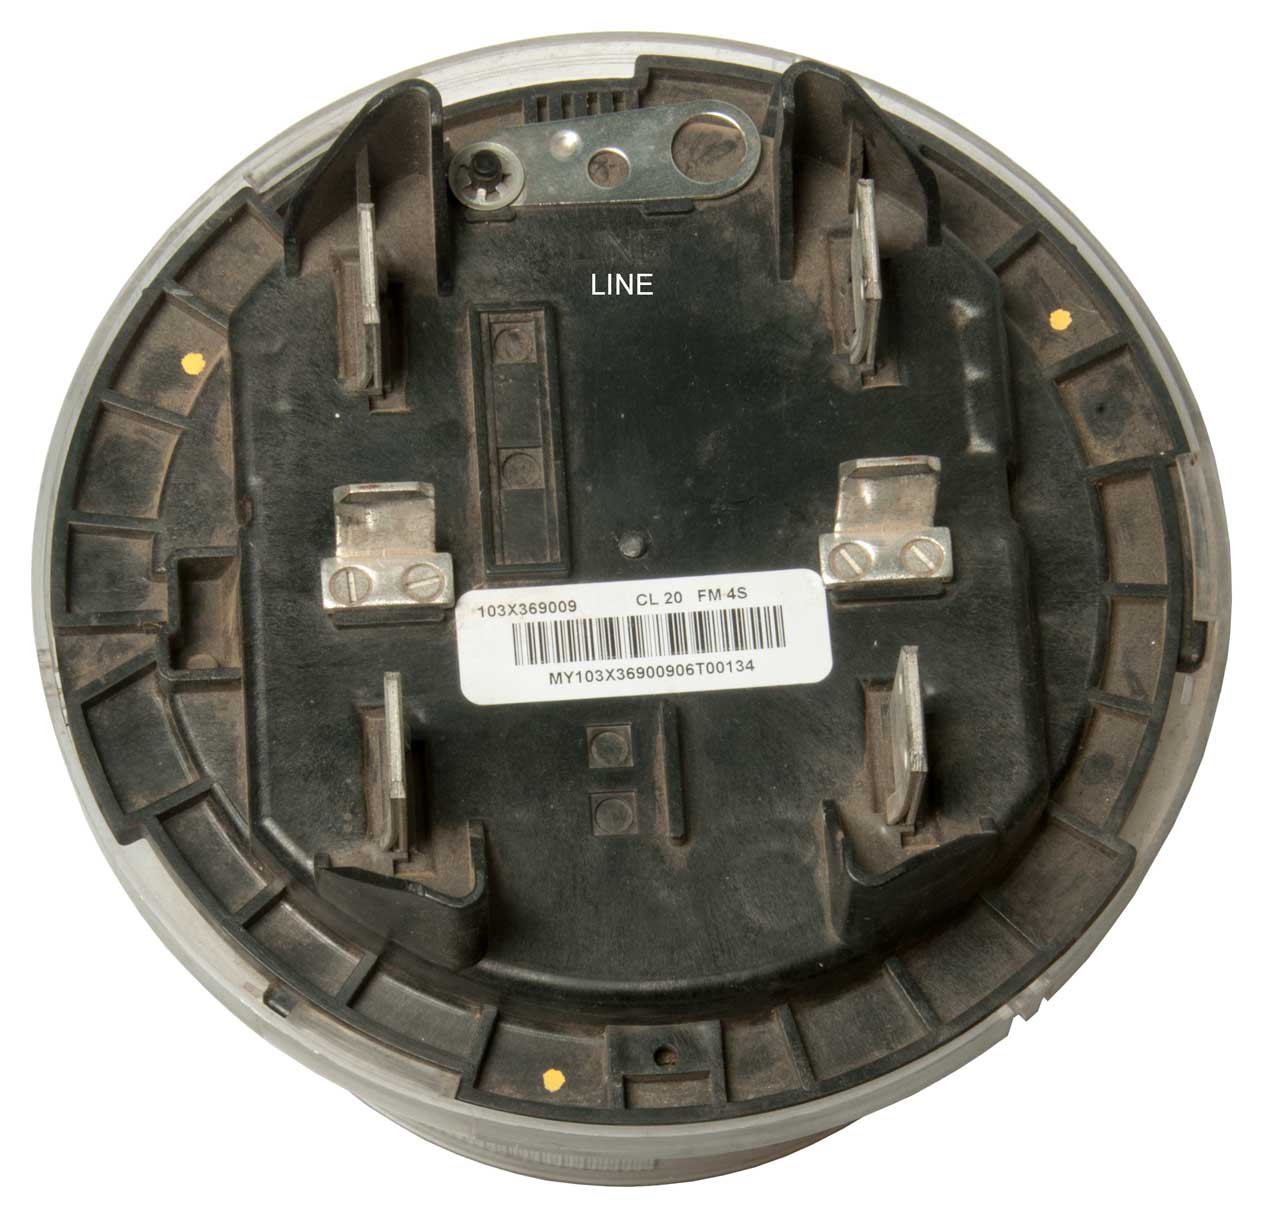
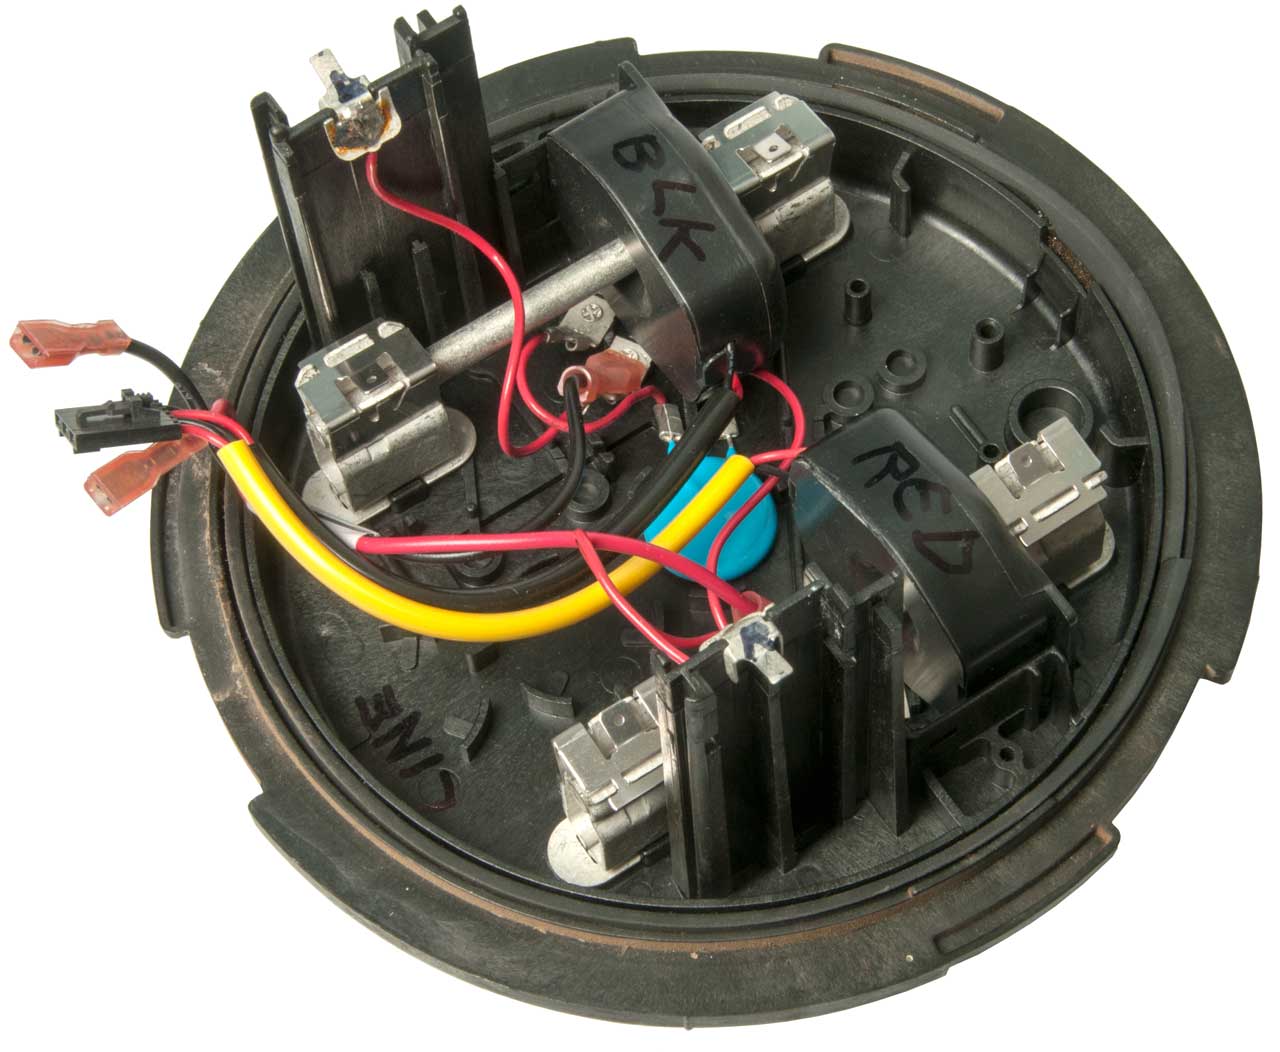
Socket Wiring
The top two lugs are line input from overhead or underground AC mains.
The bottom two lugs are line output to house.
The function of the center two lugs is not clear. They are insulated from each other and from the two line terminals.
Let me know about the center two lugs.
Fig 1
Fig 2 Line lugs at top, ??? at center,
and output at bottom
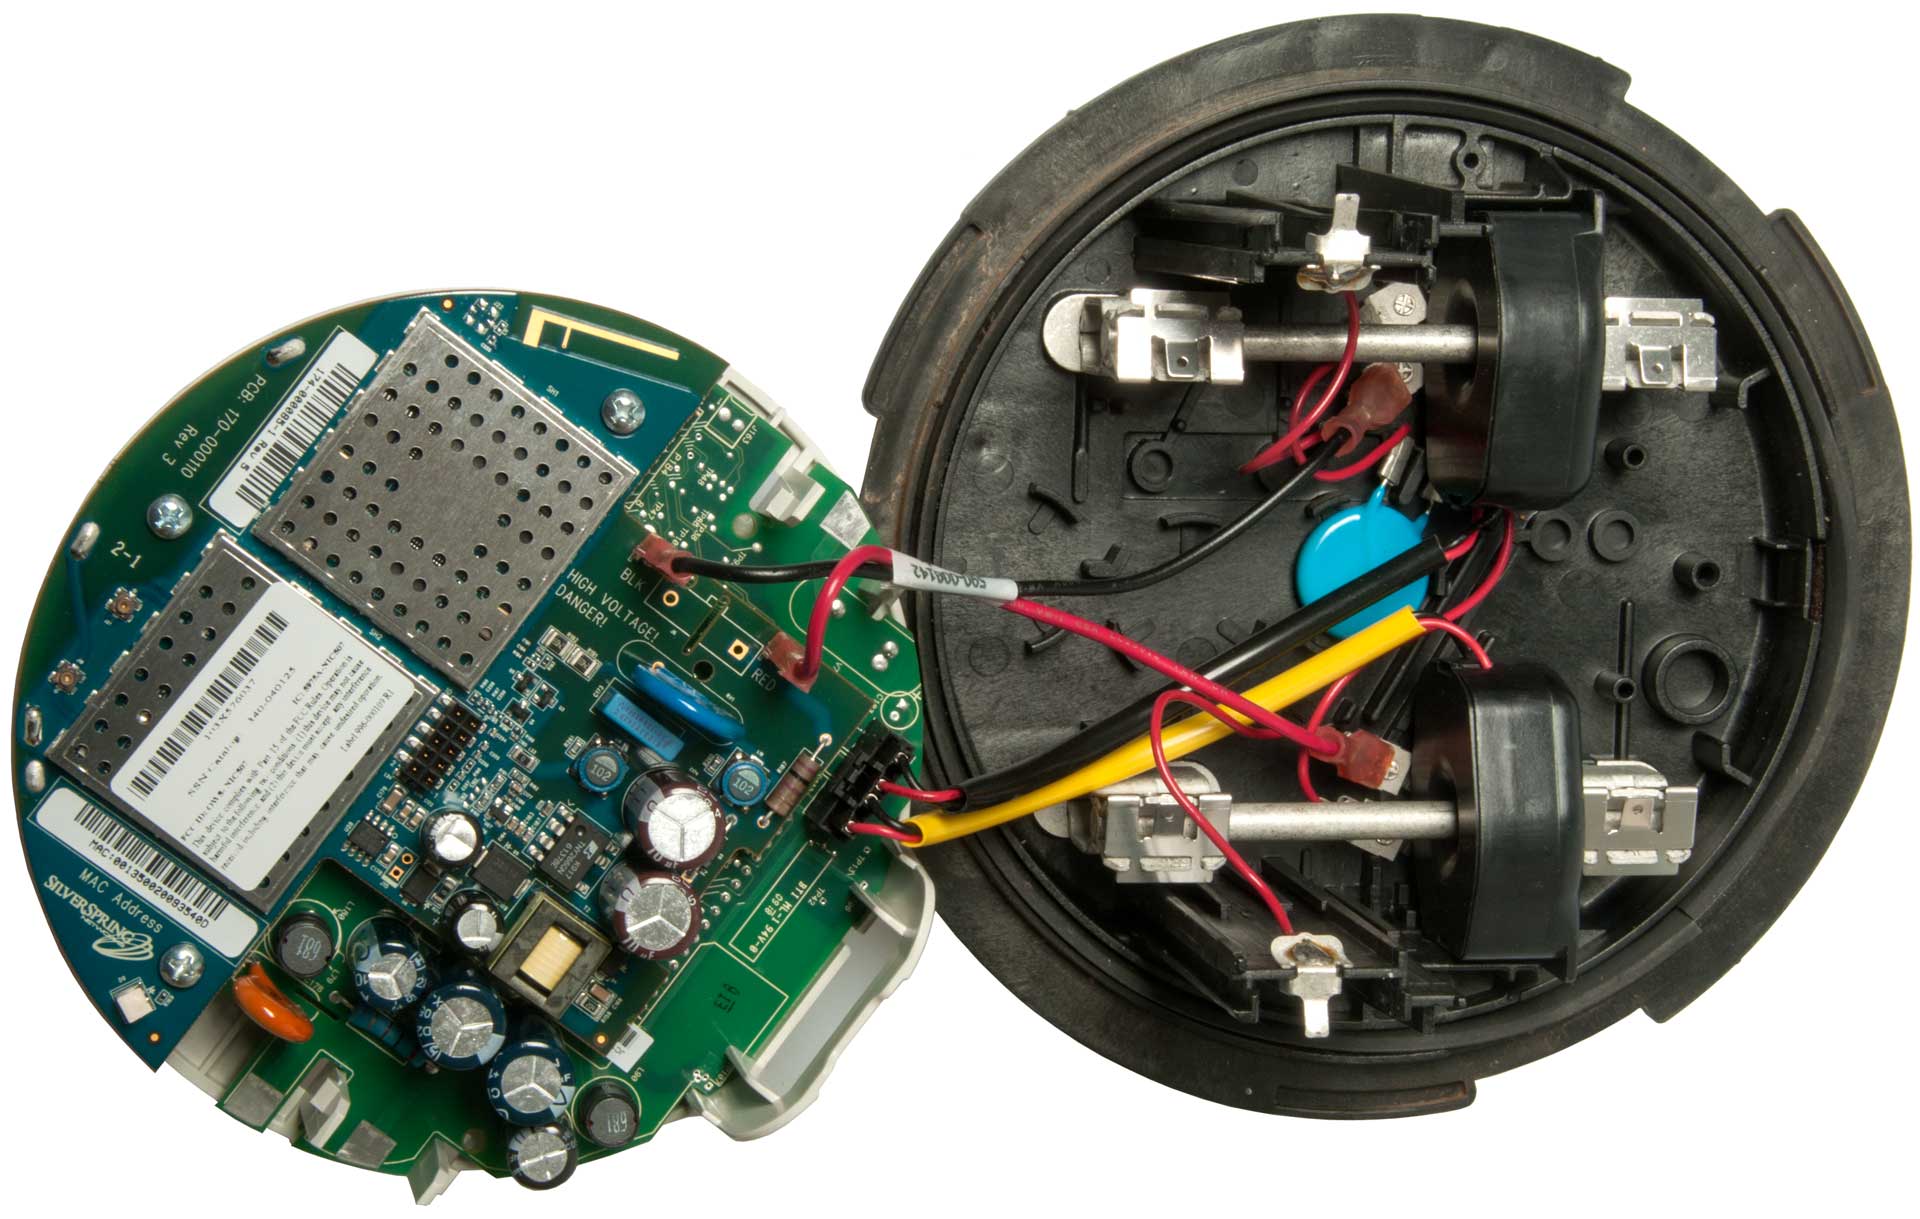
Fig 3 Rods connect Line toOutput.
That way the current transformers
can be wound without a gap.
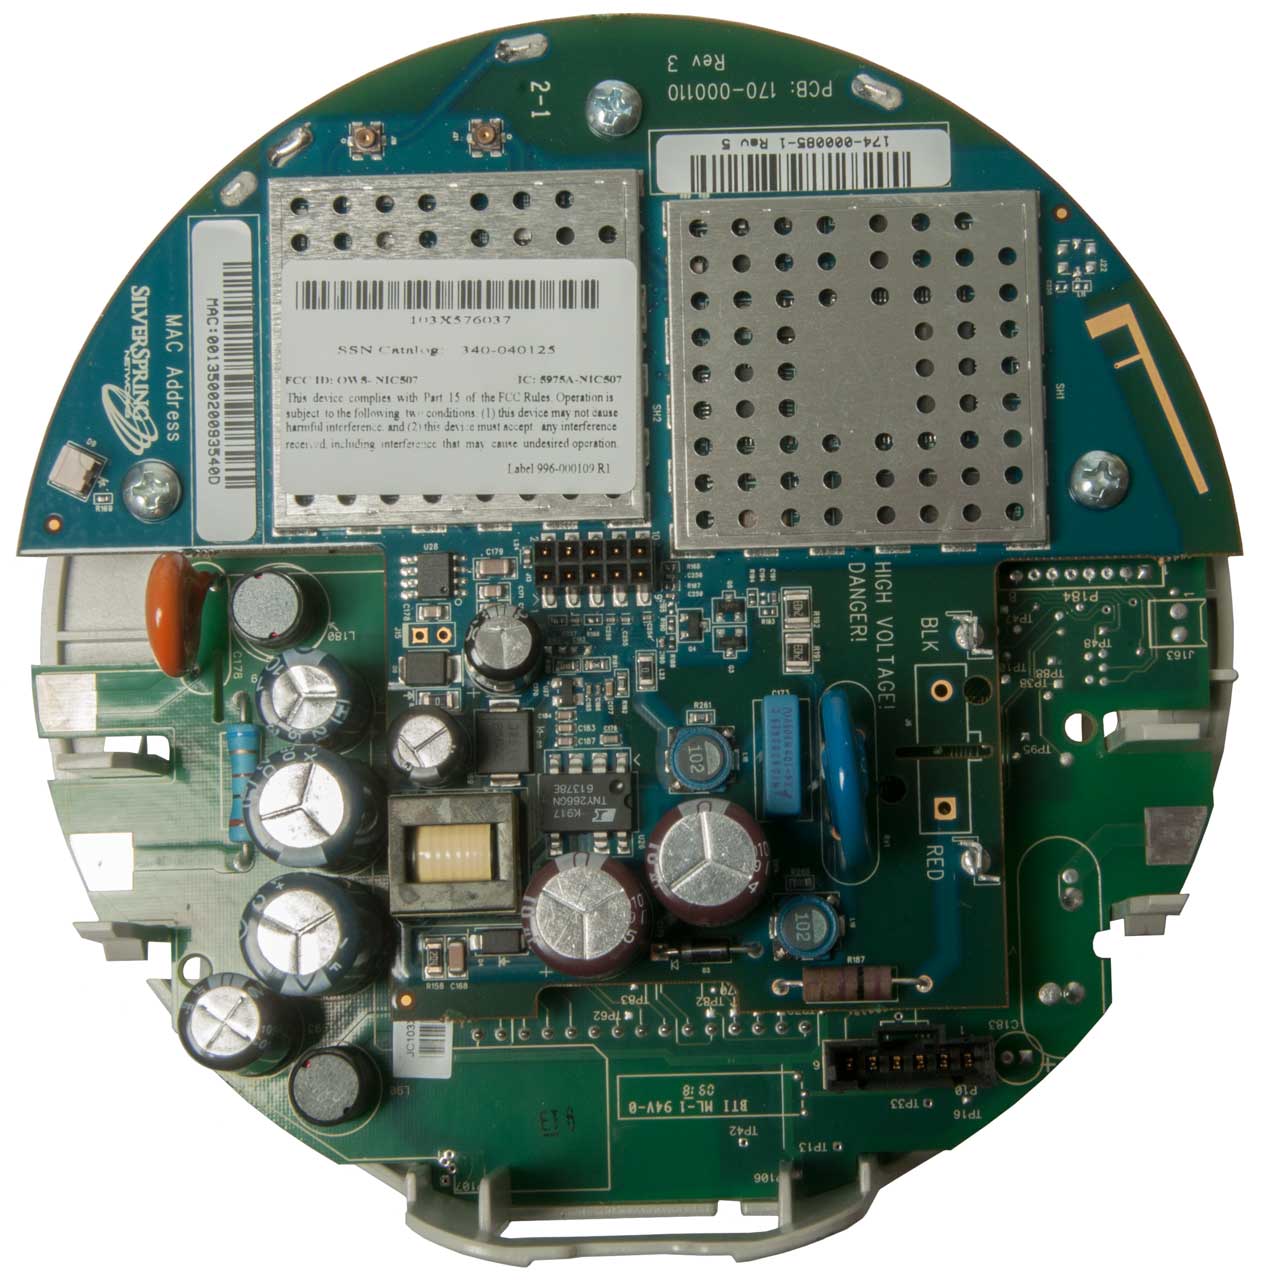
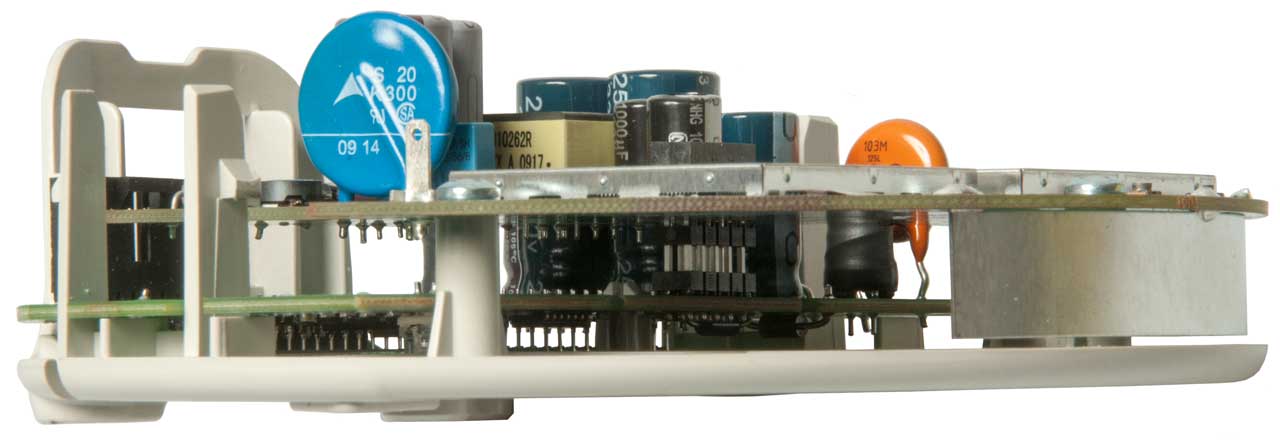
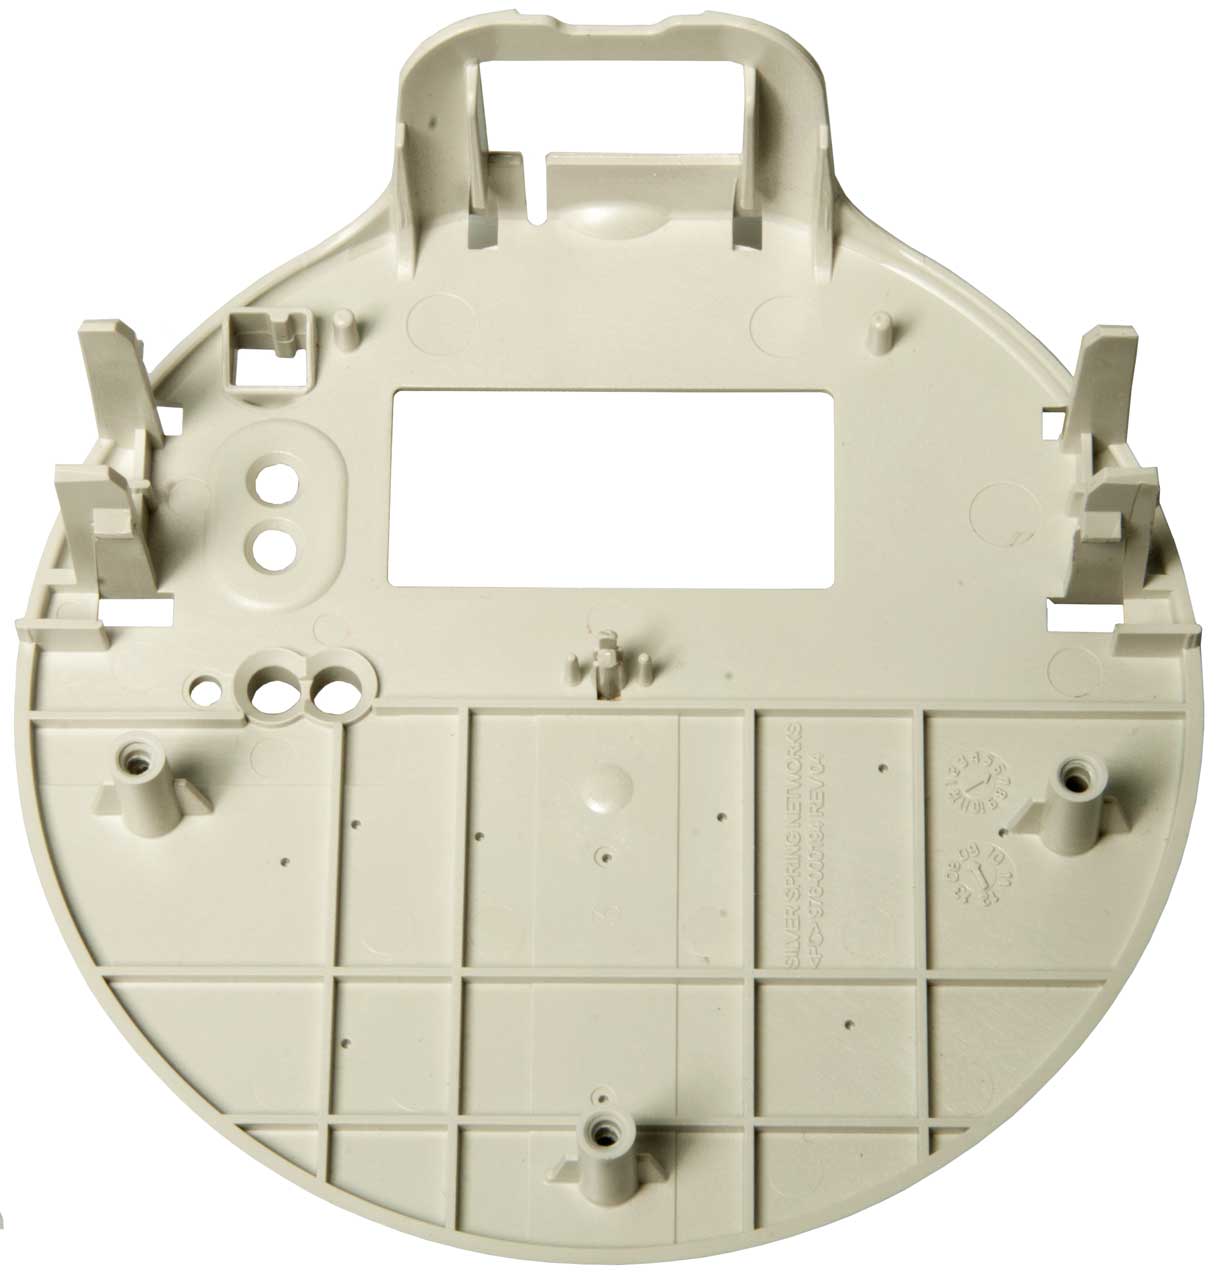
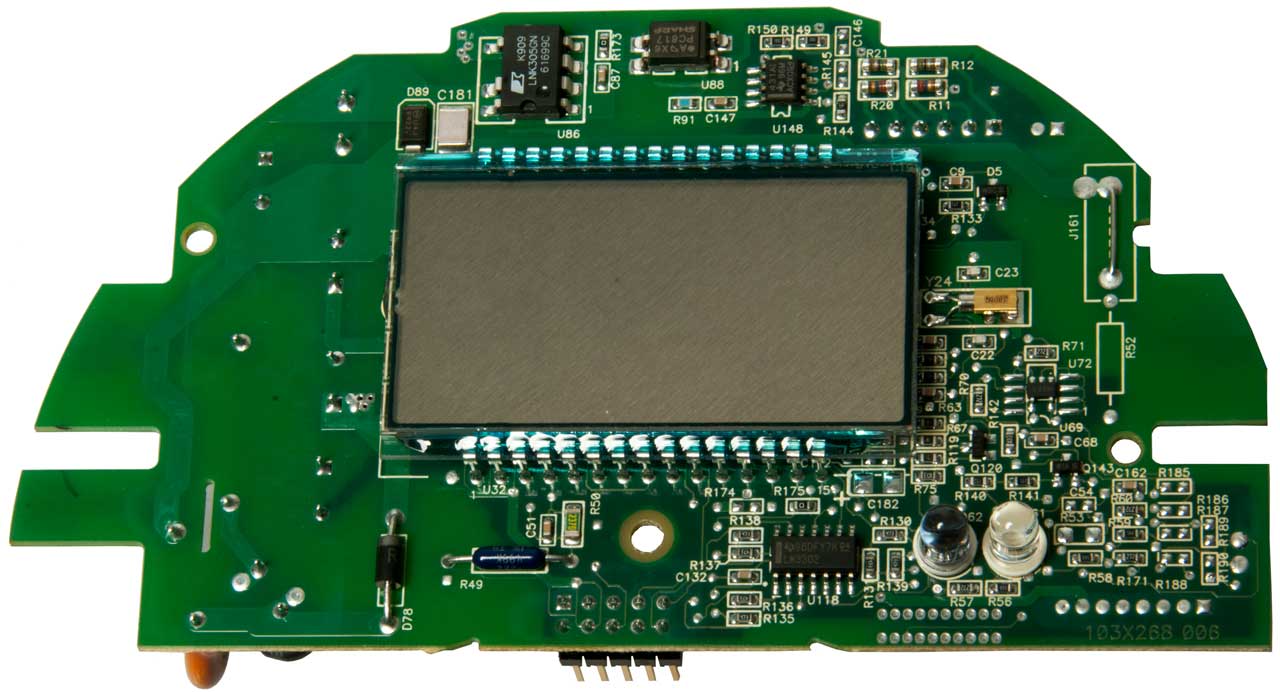
Fig 4 LCD board at front
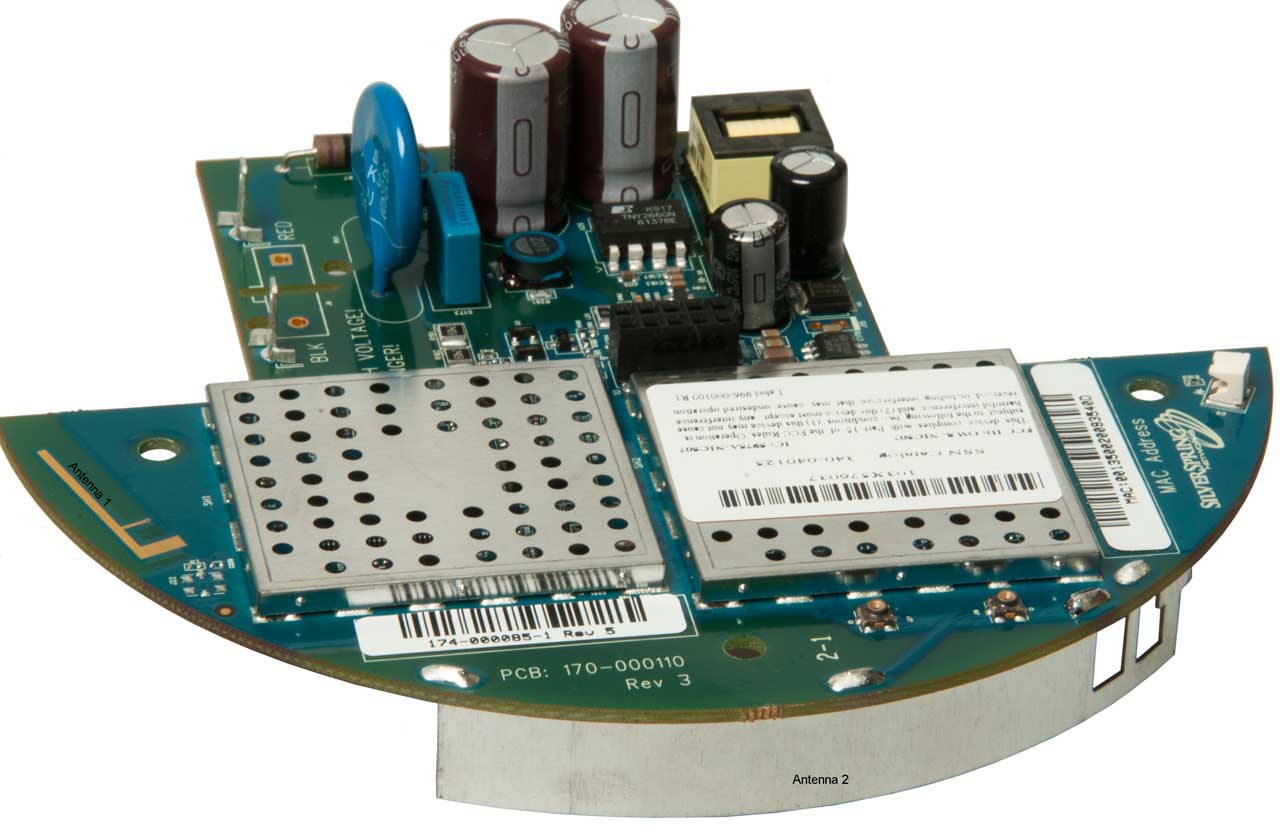
two radio modems just behind front
Fig 5 other side of radio modem board has
sensing circuitry and power supply
Fig 6 Line lugs at top
Fig 7 Line lugs at left
Fig 8
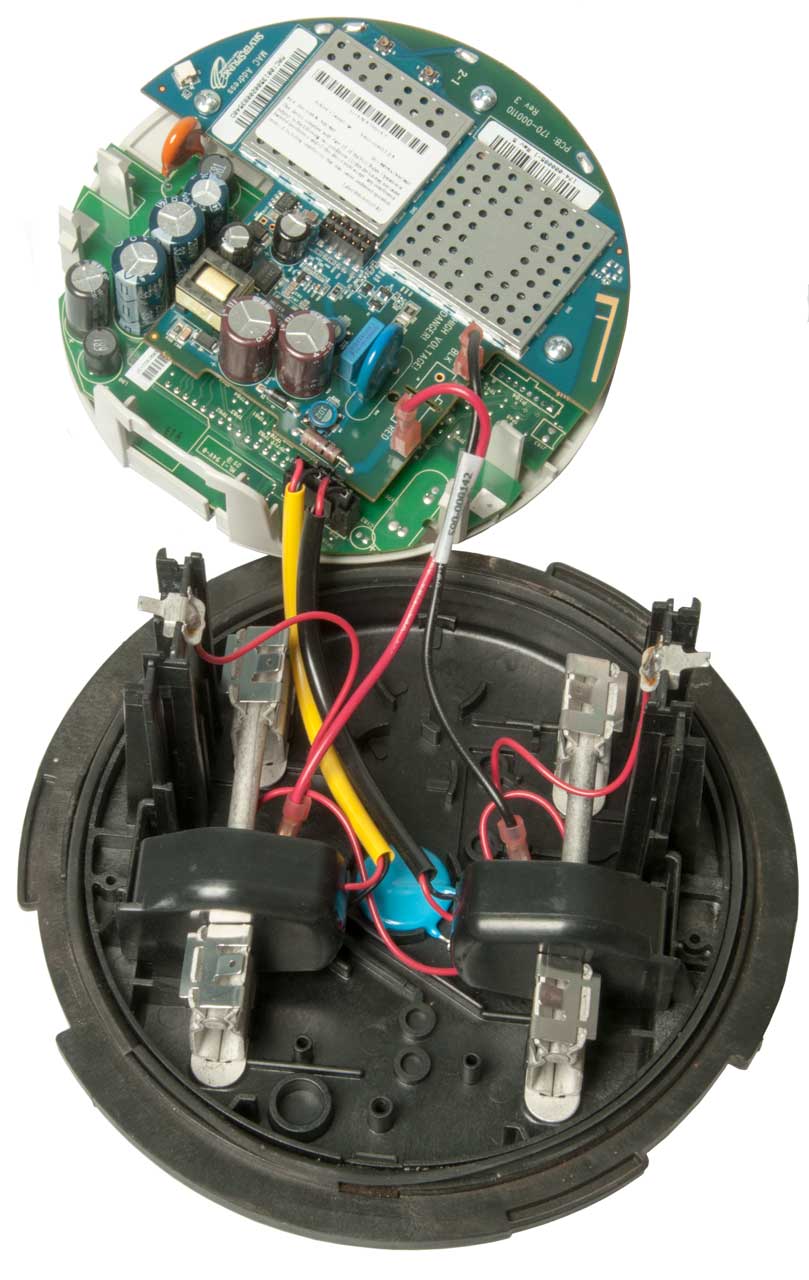
Black spaghetti tube = Black Line
Yellow spagetti tube - Yellow Line
Both current transformers go to a
single 4 terminal connector.
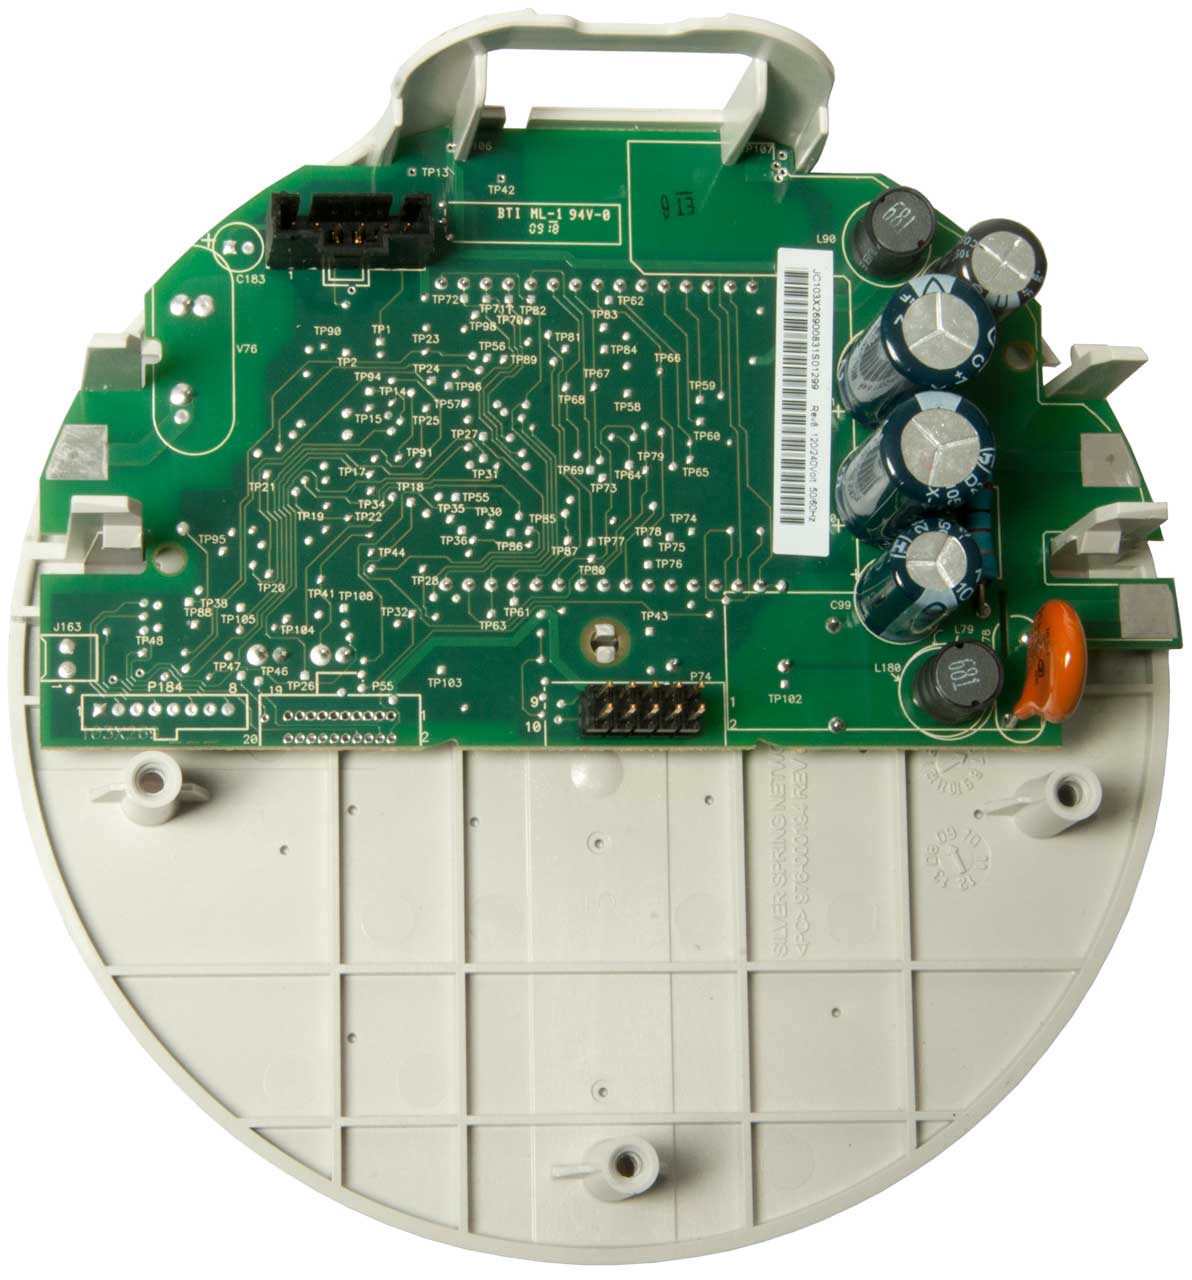
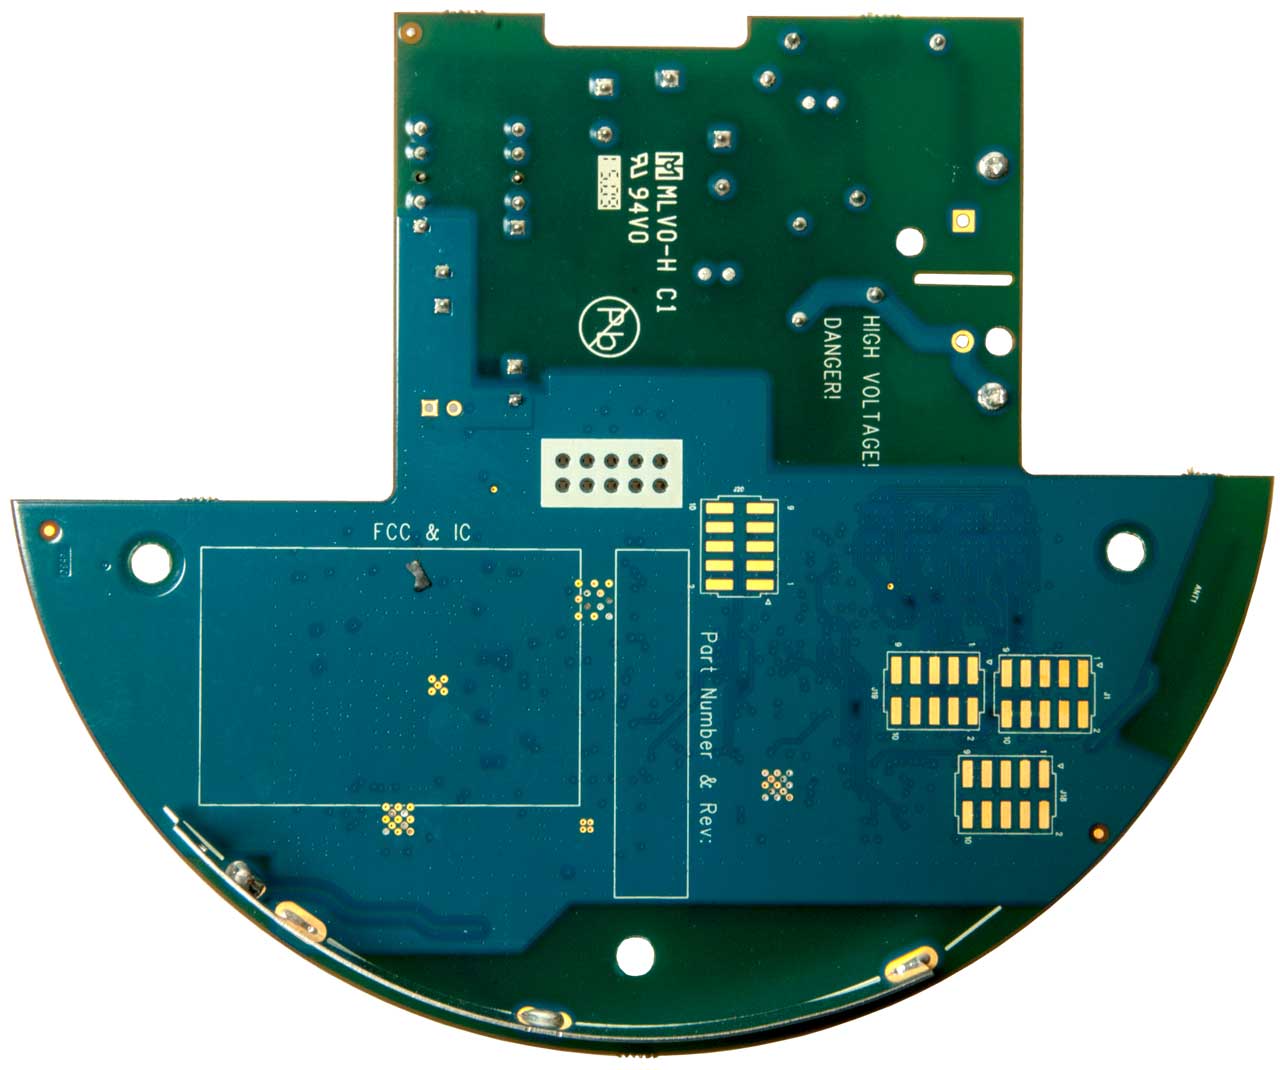
Fig 9 Back of combined radio board
and Front panel board.
Fig 10 Radio board on top,
Front panel board on bottom.
Fig 11
Fig 12
Fig 13
Fig 14 The current transformers connect
directly to this display board as well as
the voltage on the thin red wires.
Fig 15
Ant 1:
Ant 2:
Fig 16 reassembled w/o plastic frame
Fig 17
PG&E Green Book.pdf, 976 pages, Section 5 Electrical Metering -
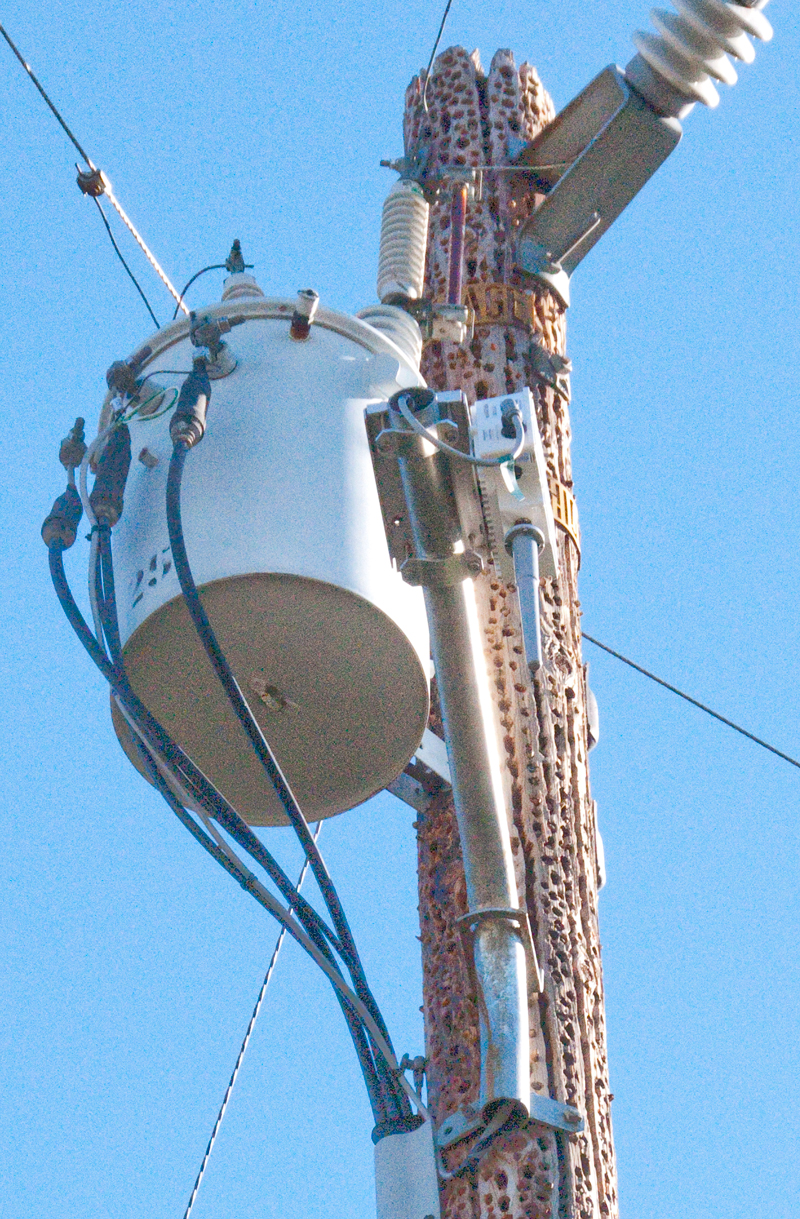
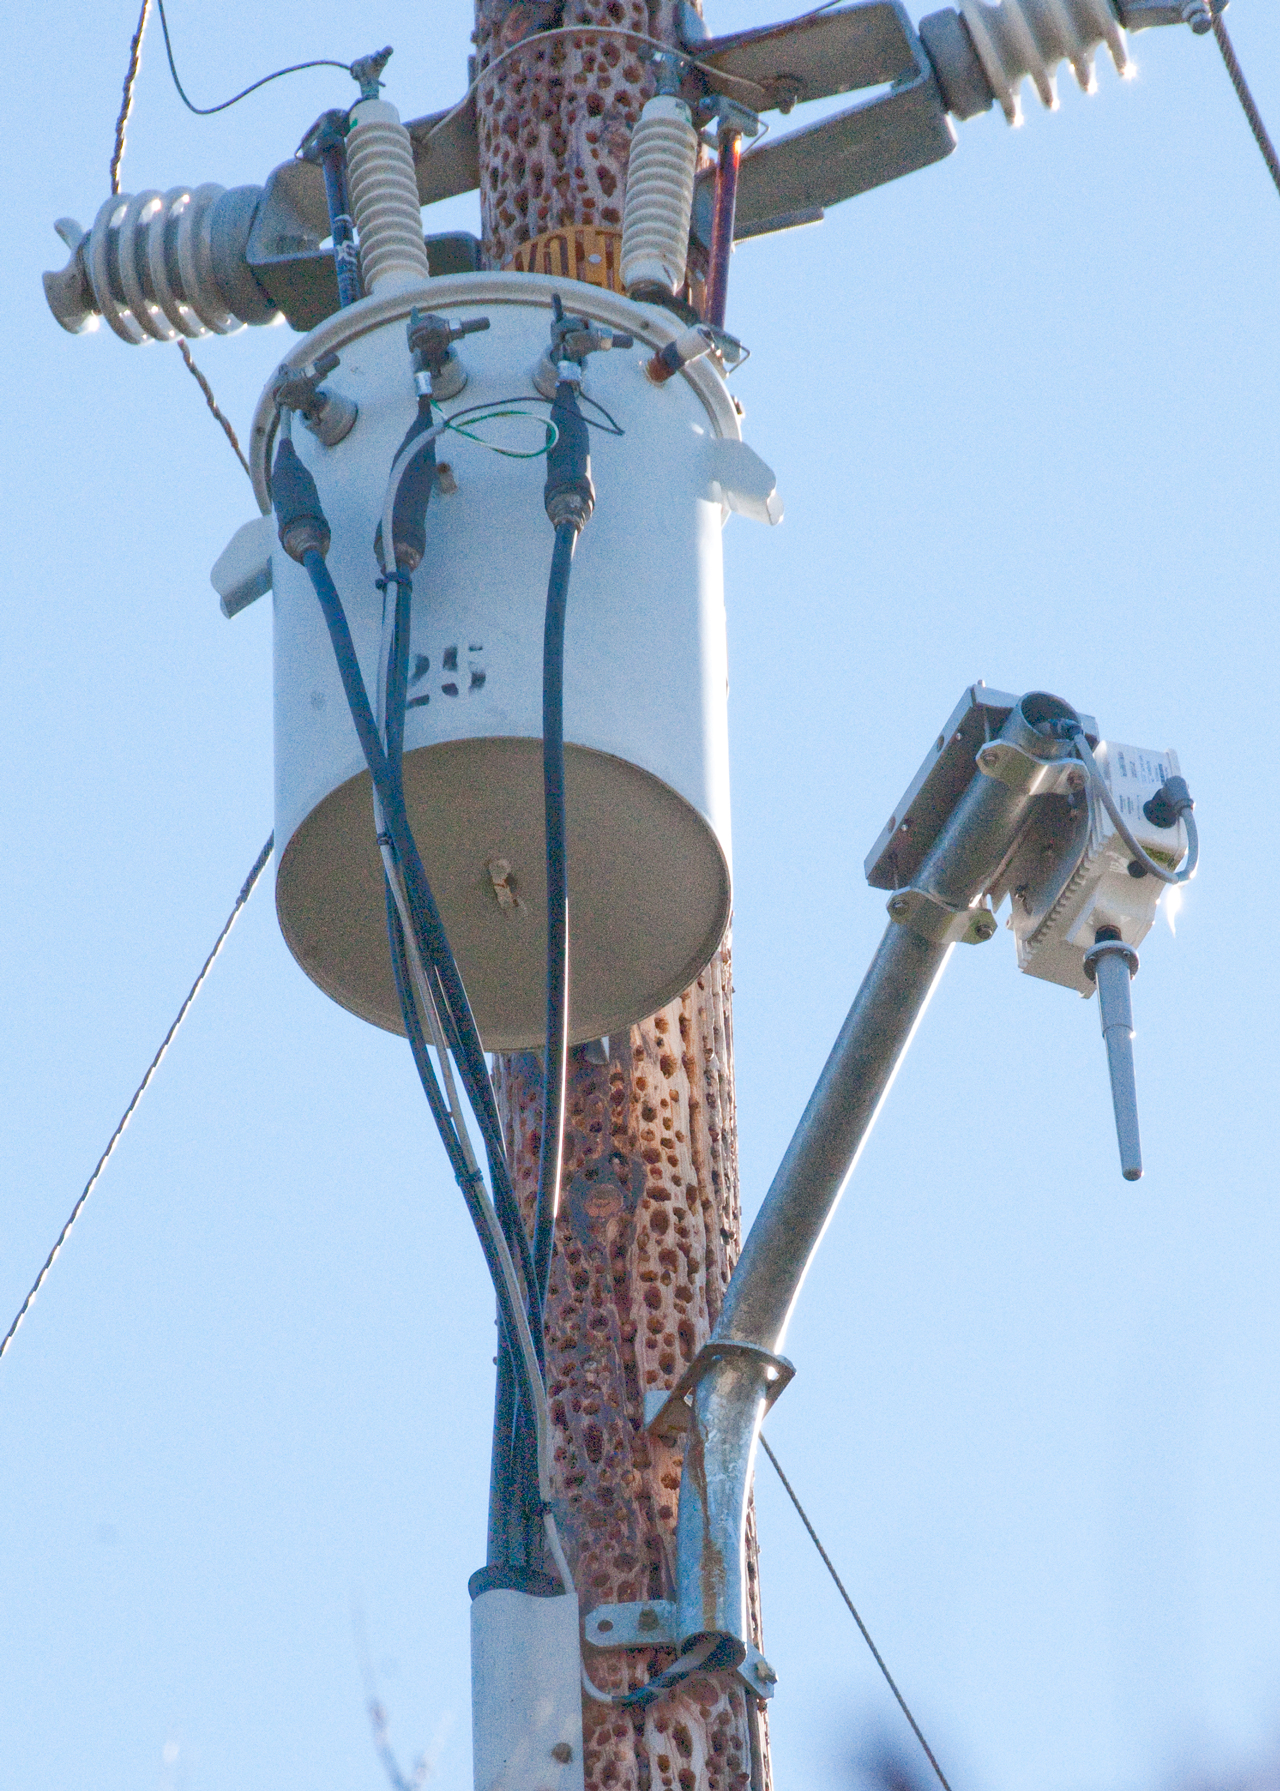
Repeater
Although the smart electric meter was installed in Nov 2013, it was not until Jan 2015 that it worked. The problem was the mesh network could not reach to the collection center. To fix that PG&E installed a repeater on a power pole on a ridge line that has a very long line of sight.
Since PG&E already has a center tapped 240 VAC transformer on the pole (120-0-120) they wired up the 120 VAC power to the repeater directly to the transformer.
Green and white to the center tap and black to the right side 120 VAC terminal.
The local woodpeckers like this pole.
Also see my telephone pole web page and Ukiah birds.
Energy Highlights
Select "My SmartMeter™" and view your Energy Highlights for quick
facts on your monthly energy usage, like what your next bill is
projected to be, and your average daily cost for energy.
Hourly/Daily Usage
Select "Usage" and view your Hourly/Daily usage to see your gas
usage by the day or your electricity usage by the hour.
Energy Alerts
Select "My SmartMeter™" and sign up for Energy Alerts to receive
your choice of a phone call, text message or e-mail letting you
know you're projected to move into Tier 3 or higher during your
billing cycle. You'll also receive additional alerts if you move
into Tier 4 or Tier 5.
The idea is to have various appliances connected to a network
including the smart utility meters so that they can be turned on
remotely in such a way as to use energy when it's not in demand.
This network will not be a normal home WiFi type network because
each appliance needs it's own URL and there are not enough of
them. But it can operate using WiFi protocol.
Residential customers may elect to enroll in PG&E’s Smart
Rate program, which is designed to encourage customers to reduce
their electricity usage at during peak periods.
Participants in Smart Rate may also elect a bill protection
option for the first full summer of participation."
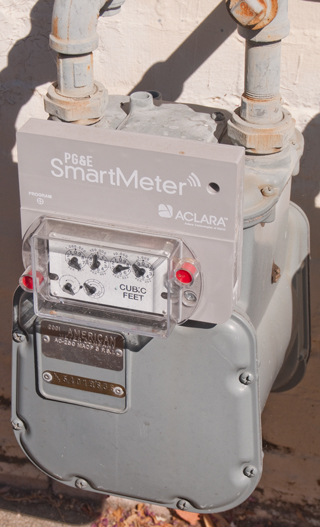
ACLARA does networking and smart meter readers.
Meter in downtown Ukiah on retail building.
You can see that it's a applique that's been added between
the body and analog readout rather than a whole new meter.
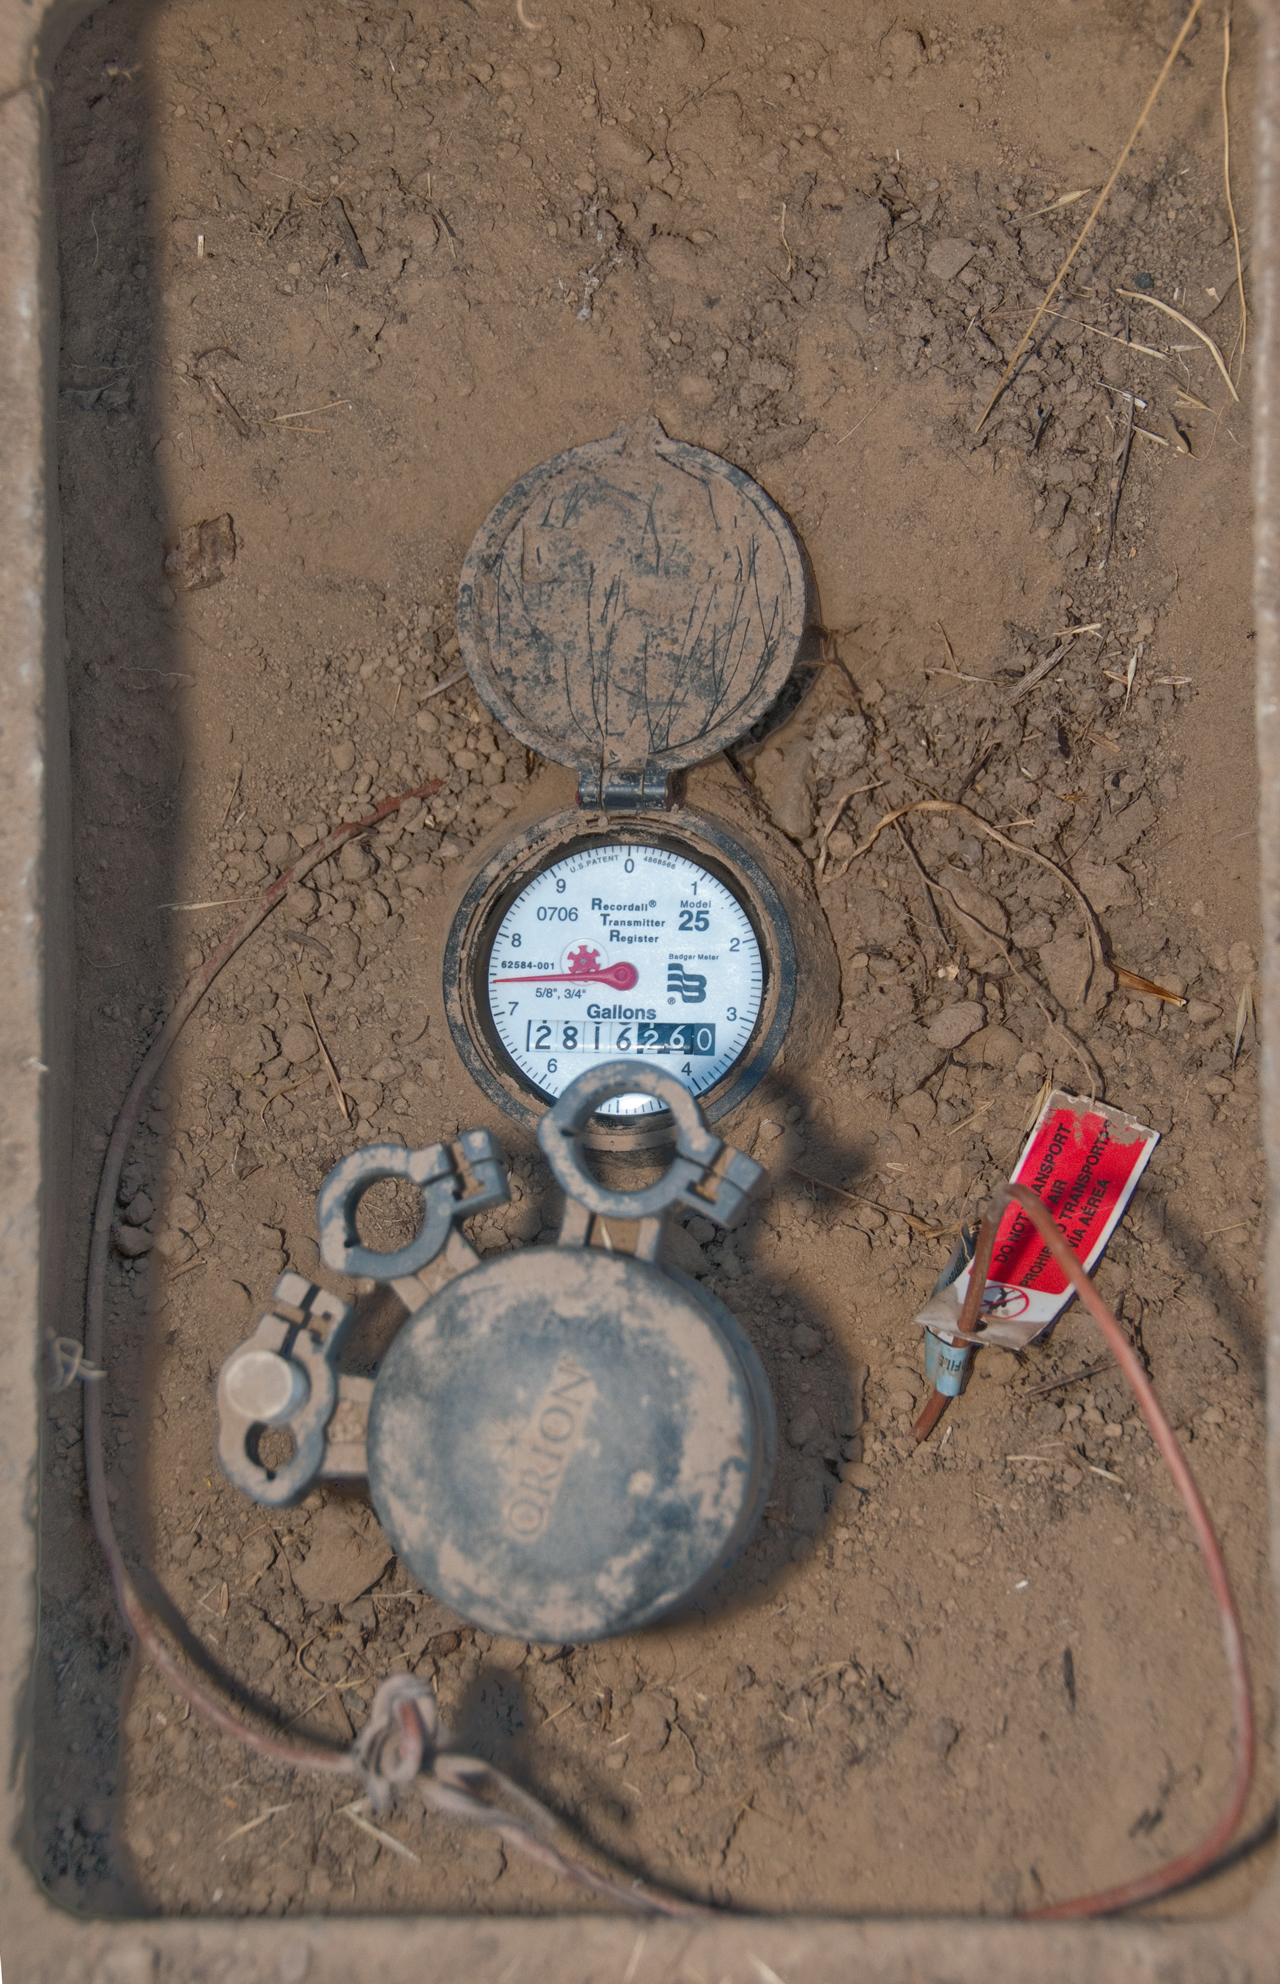
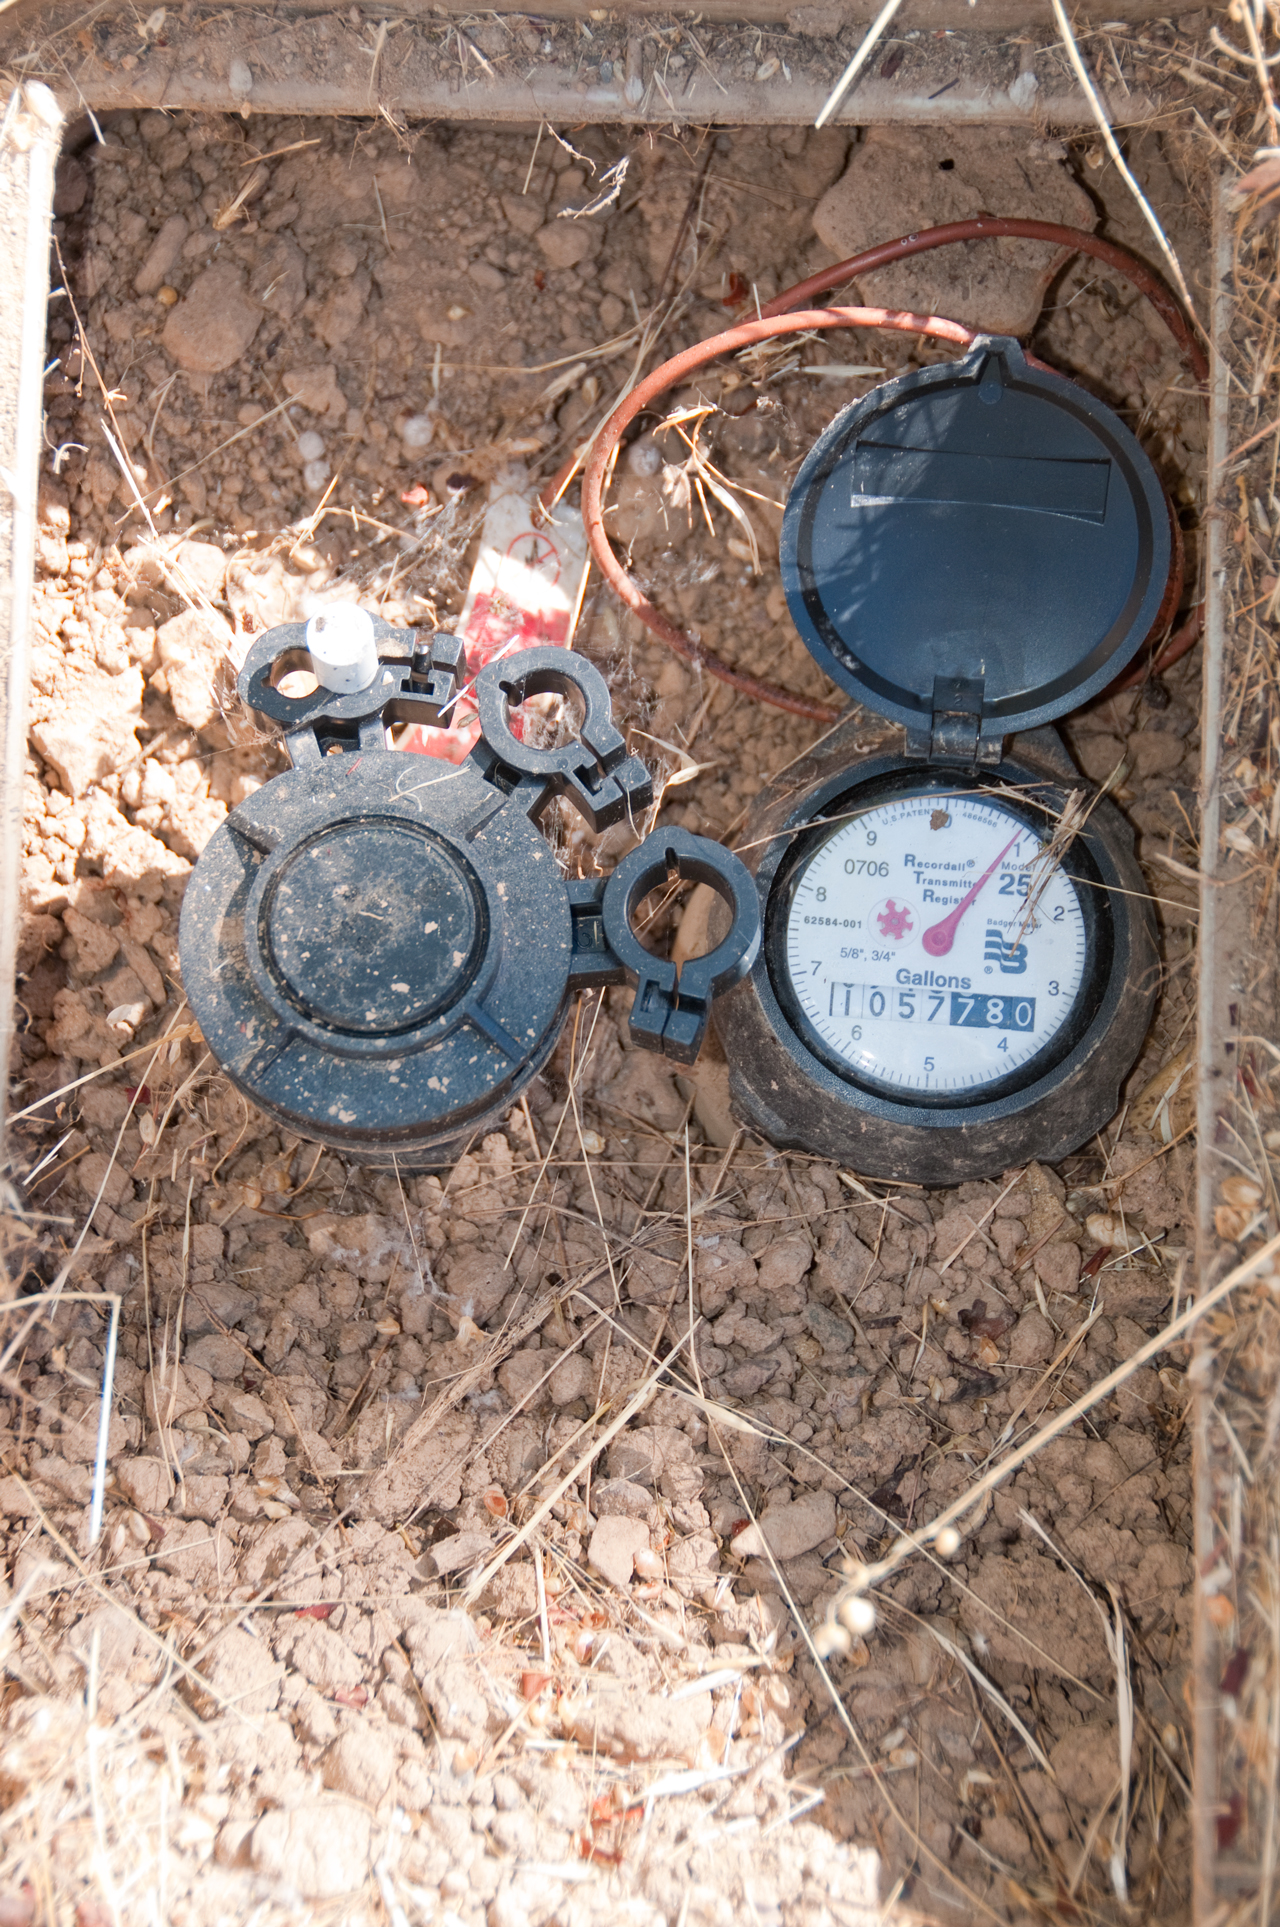
A friend's meter.
This is a Badger-Meter, Recordall Transmitter Register Model 25 for 5/8" or 3/4" lines. Reads in Gallons. The transmitter is marked Orion.
Note: there are 4 digits with white background and 3 digits with black background. The rightmost digit is the 10 gallon test circle so does not move.
That leaves 4 + 2 = 6 digits that are live meaning the maximum reading is 9,999,999 or 10 million gallons.
The ideal location for the Orion RF (902 - 915 MHz ISM Wiki) transmitter would be in the lid of the utility box rather than below it for better transmit range.
Badger-Meter also makes an In Home Display that might work with this meter. That would be great for detecting leaks. But that might require repositioning the Orion transmitter so a stronger signal could get to the house? It turns out that the In Home Display only works if the utility company is using a Wi-Fi network to read the meters (i.e. if there's a Wi-Fi signal to feed to In Home Display. But Millview Water has not installed the smart meters with the antennas above ground and has not built in relay infrastructure needed, the meter reader still needs to get within a few yards of the meter in order for his laptop to get the wireless signal.).
The meter uses a piezo spark generator to send a high voltage pulse to the Orion transmitter. That may be it's source of power or it may have a long life battery?
Badger Meter, Inc., Sep 19, 1989, 340/870.3, 324/157, 310/339
4868566 Flexible piezoelectric switch activated metering pulse generators,
Called a "High Resolution" meter in patent 5298894.
5298894Utility meter transponder/antenna assembly for underground installations, Badger Meter, Inc., Mar 29, 1994, 340/870.02, 343/872, 340/870.01, 343/719, 324/74 5476731 Field-replaceable battery pack and method for underground installations, Badger Meter, Inc., Dec 19, 1995, 429/97, 429/98, 429/99, 429/100
This is a walk by automatic meter reading system.
6300907 Antenna assembly for subsurface meter pits, Badger Meter, Inc., Oct 9, 2001, 343/700.0MS, 343/846, 343/719, 343/850
7626511AMR transmitter and method for both narrow band and frequency hopping transmissions, Badger Meter, Inc., Dec 1, 2009,
340/870.02, 340/870.18, 370/310, 370/338, 340/870.01
Water Leak
The water bill was way too high so looking for a leak.
Here's a plot supplied by the water company:
My interpretation of the above plot:
The spikes are the irrigation timers because those are set to open once every other day for an hour.
The spikes appear to alternate where one is high the next is lower the next is higher and so on.
These spikes are mostly over 170 gallons and the time between the high and high (or low and low) is every other day, the same as the timer programming.
That amounts to over 5,000 gallons in a month, far exceeding normal total water usage, so a major problem.
Although the actual number of gallons varies a little that's probably due to changes in water pressure.
So there's two different irrigation circuits that each have a leak.
The drip irrigation emitters are about 1 gallon/hour and the timers are set to be on for one hour every other day.
A typical drip string has maybe 30 emitters, or should use 30 gallons in the hour and do that once every other day, but the actual usage is 4 or 5 times too high.
There are two kinds of problems with drip: First the end of the 5/8" tube opens or second, the emitter or 1/4" line opens. Since there are a lot of the 1/4" emitters and lines these easily get broken. Since there was a deer (although a fence is supposed to keep them out) in the exact place the emitters are located, i.e. at the Rose bushes, it's probable that a deer has broken many of the 1/4" lines.
Along the bottom there's a pedestal keeping the usage from going to zero and these are constant leaks.
These are the classical leaks, things like a toilet that never stops running, a faucet that always is dripping, a garden hose on all the time, etc.
I think these small leaks are what's keeping the curves from actually touching the zero use line, but instead being a few gallons above it.
On very hot days (the plot includes many days that are in the area of 100 to 110 deg F) the auto fill for a swimming pool will be adding water with a long time constant, i.e. it may take many days to make up the evaporation since the valve is identical to those used to fill toilet tanks.
This may explain the pedestals.
A rough estimate for normal evaporation would be 1/4" per day. If the pool was 16' x 40' that's 640 square feet times 1/48' of evaporation is 13.3 cu ft or 100 gallons/day.
If the meter sample rate is once peer hour then 4 gallons/hour would account for evaporation.
It turns out that one drip irrigation line uses 10 gallons in 2-1/2 minutes and a different line uses 10 gallons in 3-1/2 minutes, this is consistent with the spikes on the plot.
This brings up the idea that while drip irrigation conserves water when the system is new, it can waste more water than it saves when something goes wrong.
I've experienced a couple of occasions where the end stop on a 1/2' or 5/8" line opened up, wasting a lot of water. If 1/8" line is used to feed an emitter it's very common for the line to get pulled out of the main line by an animal. It's also common for an emitter to break creating a water fountain (if it's pointing up) but if it's pointing any other direction you don't see that there's a problem. So for the most reliable drip irrigation system only use large (1/2" or 5/8" line) and only install the emitters pointing up so you can see when there's a leak. Do NOT bury the system since that will hide problems.
My Meter
Because my friend has strange numbers on her bill, I checked my bill and for Aug 2014 it shows:
Last year 23
This year 3355
But there are no units of measure.
I looked at my water meter and it's been changed to a smart meter and they never told me they did that.
The radio transponder is made my American Meter Co.
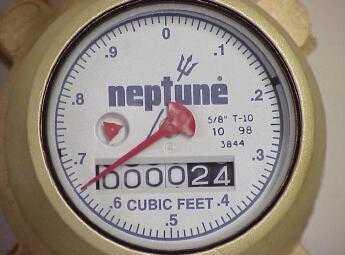
Analog Water Meter
Analog water meter reads in cubic feet.
Notice the 4 white background digits are hundreds of cubic feet (748 gal/unit)
These are the units on my old water bills.
The rate in 2008 was $1.29/100cu ft.
There are other items on the bill that are fixed amounts related to the meter and cost of capital.
In 2014 the rate is $0.00192 per gallon
The old rate $1.29/100cu is equivalent to $1.29/748 gal or $0.001725/gal
So the new rate about 11% higher.
June 9, 2014
Reading shown is:
1057|780|1 (format: WWWW|BB|P)
which is 105,778 Gallons since the meter was at zero.
If the typical monthly usage was 3355 gallons the meter was installed about 35 months ago,
or October 2011 is when it was installed.
Note the new meter reads in gallons and the prior analog meter read in hundreds of cubic feet.
The difference is the new meter reads 748 times higher numbers.
That's why the new meter has 4 digits with a white background,
i.e. the units on the white background are hundreds of gallons.
The billing rate needs to change to account for the change in units and that in turn depends on
how the meter is being read.
My current bill has the numbers for previous and present all jammed together like this:
00105347001056828 which is a 17 digit number not easy to divide into two numbers.
The Model 25 has 4 white digits, 2 black digits that change and the pointer which takes 10 gallons to make a full circle. So my readings are as shown below.
WWWW is the white background, BB is the black background and P is the pointer.
format: WWWW|BB|P
Previous: 1053|47|0 Gallons
Present: 1056|82|8 Gallons
--------------------------------------------
Difference: 3358 Gallons in 30 days or 111 Gal/day. ($ 6.44 for the water)
The bill shows a difference of 3355 Gallons, why?
The rate is $0.00192 per gallon, or 0.192 cents per gallon, or about 20 cents per hundred gallons.
April 16, 2024
Battery is near dead in radio. Replacing both the radio and meter.
New unit has connector between radio and meter so next time only the radio will be replaced.
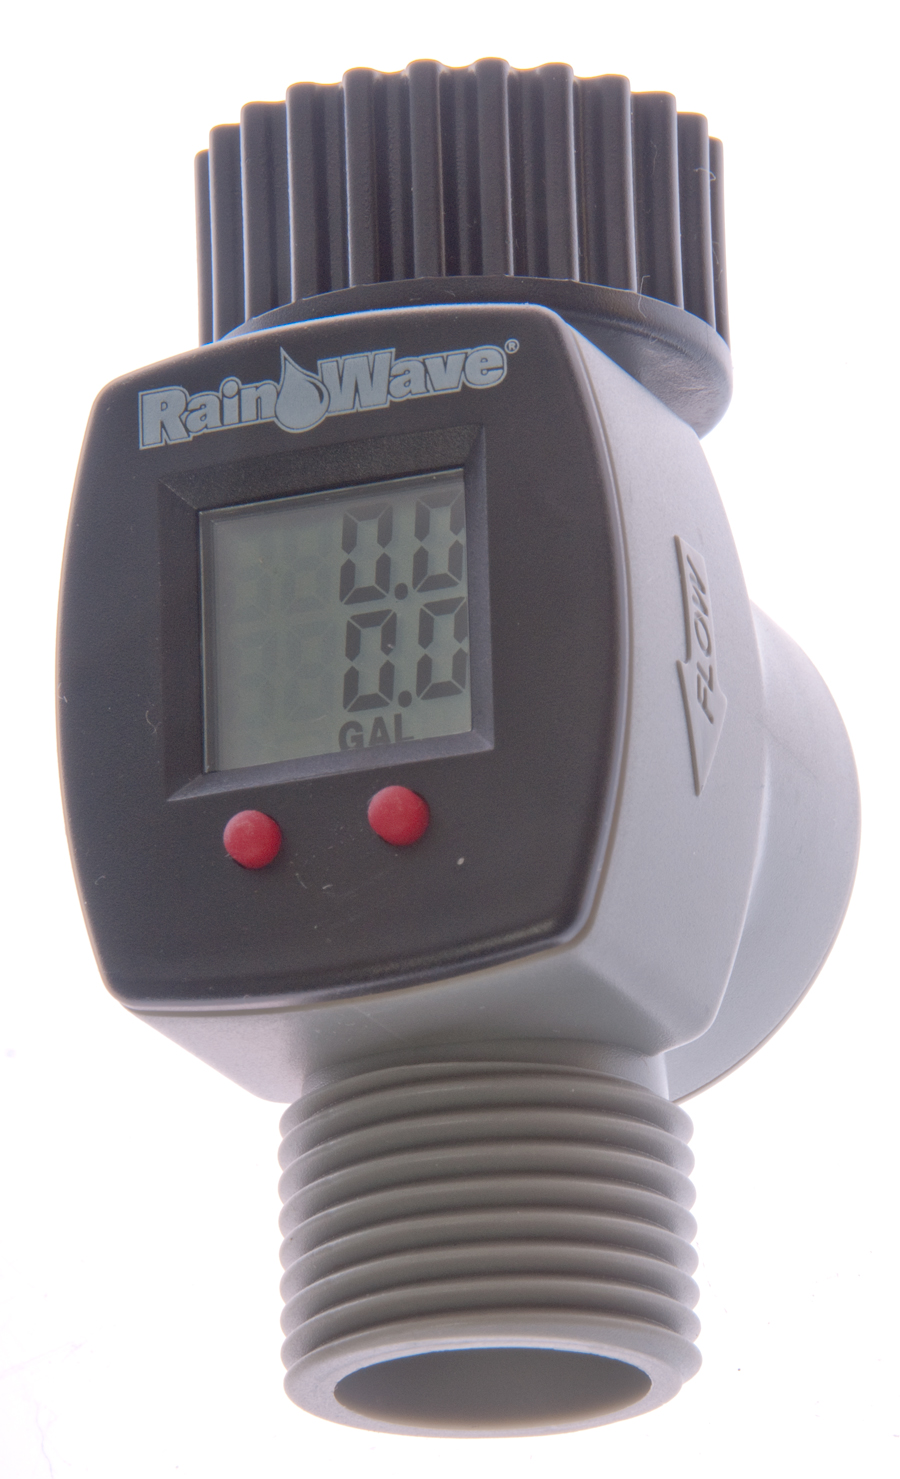
Hose Bib Digital Water Meter
Got this as a way of checking for leaks.
Top and bottom reading to 999.9 Gallons or Liters.
RainWise RW-9FM Digital FLow Meter
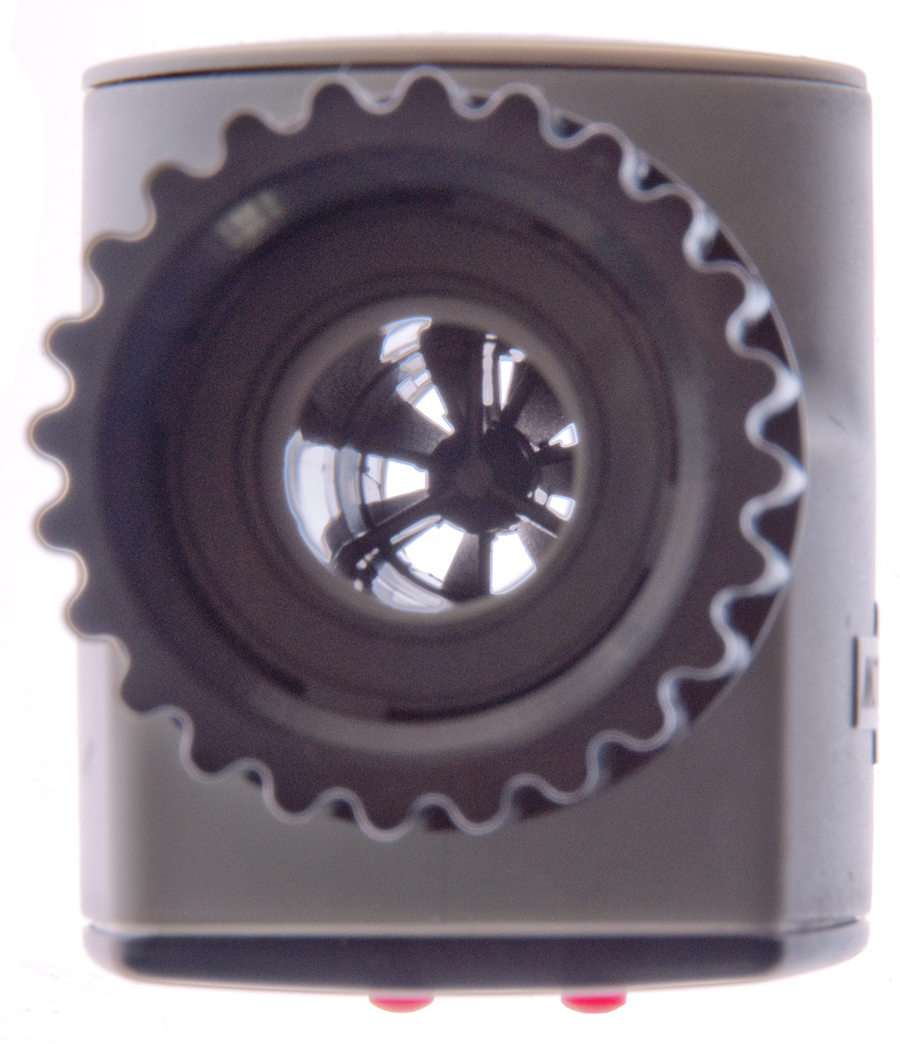
Turbine
CR2032 Battery
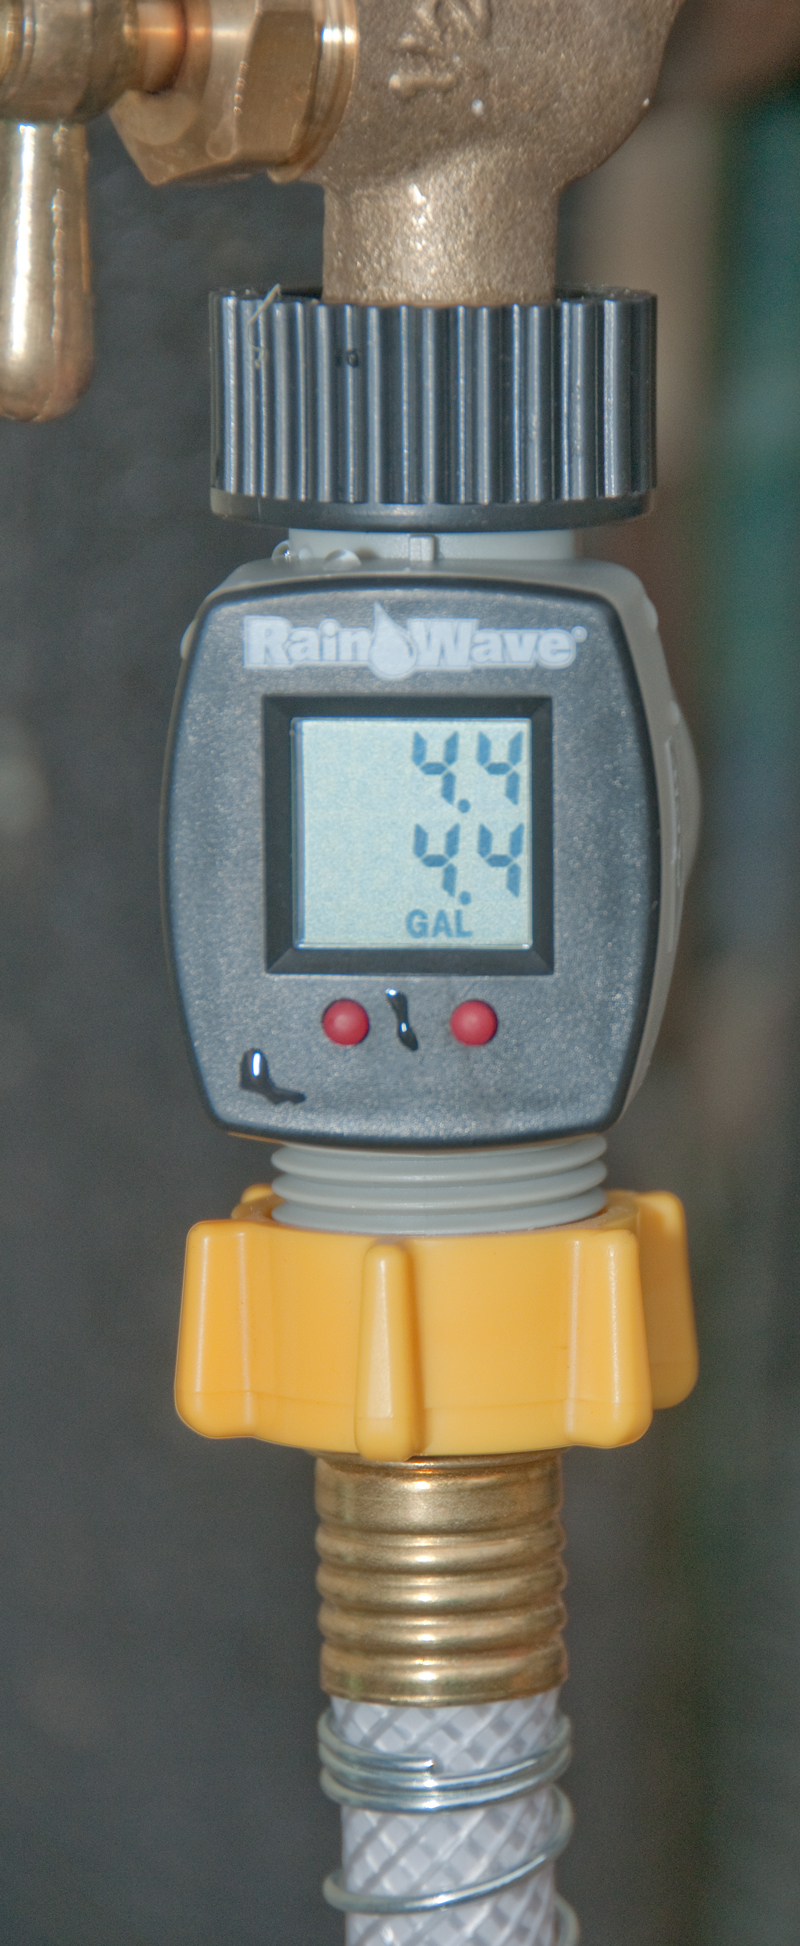
5 Gallon Bucket
11-1/4" dia at top
10" dia at bottom
average diameter: 10.625
Bucket: 14" tall
Fill to 13" for 5 Gal. (1155 Cu In) Ridge at fill line.
5 Gal Bucket filled to 5.0 Gal
Meter after filling bucket reads 4.4 Gal
112% error.
Leaks.
Instructions
Press left button to zero top reading.
Press and hold right button to zero top & bottom reading.
Press and hold left button until Gal or LIT flashes, then press right button to toggle between GAL and LIT, then press left button to set.
2025 October - FerrellGas no longer supports the phone app. Use MyFerrellGas.com instead. This requires knowing your account number.
An empty tank is one of the problems with having propane for heating a house. With the cold snap we are having in Jan 2023 the tank can run out if the local company does not drive by and check the level.
One way that should help is to add a Cell Phone connected tank monitor, like those made by Otodata. But even this can fail resulting in a empty tank. If the delivery man arrives and the tank is empty a pressure/leak test is mandatory. The gas will not be turned on after the tank passes the test and is filled because all the pilot lights will need to be relighted. If you are not home when the propane is delivered the tank may be full but the gas turned off at the tank. This is not a problem if you do not have any pilot lights or have automatic pilot lights, but if you have old fashioned pilot lights they need to be manually lit.
PS Another problem with propane is using it for an emergency generator. When the tank runs dry in a emergency it can take months to get more propane. Even now (Jan 2023) when we hare having an extreme cold snap the propane companies are rationing how much they pump to keep all their customers with some propane.
The Nee-Vo App or an app customized for your propane provider, like FerrellFill (Google Play or App Store)can be used.
The App also has provisions for Min and Max Level Alerts as well as Notification when tank filled. A running plot can also be seen (center icon at bottom).
Fig 1
Fig 2
Fig 3 Three ranges:
0 to 25% in the red - need or order more
30 to 70% direct reading
72 to 94% the amount depends on the temperature.
FerrellFill App
The Nee-vo app is on the Google Play & App Store. Fill out the form. When adding your tank the 9 character code is printed in the upper right of the label. Use upper case without any dashes.
If you have Ferrell Gas you can use the Ferrellfill app. BUT . . .
as of March 2023, maybe because of the unseasonable cold, they are not refilling tanks around 20%, but rather letting the tank get very low (mine is not at 7%). I tried to use the call customer service part of the Ferrellfill app and it did NOT work. This is because my land line phone is registered to my account which requires going through a qualification round of questions then being transferred to a "customer service professional". But instead of that was transferred to the que waiting for a "customer service professional". But . . . the que is screened for incoming phone numbers that are not associated with current accounts, so I got transferred to the qualification round of questions. As you can see this is an endless loop going nowhere.
I've been told that if you wait for all of the phone options the last one is to speak to a human, so DO NOT ANSWER the phone tree questions honestly, but rather try pressing 0 or waiting for that last option.
WO2020236225 Methods and systems for a wireless monitoring system for a tank, Otodata Wireless Network, 2020-11-26, -
Ref 1.
Flipper Zero Kills Smart Meter?? - Reverse Engineering News - June 13th 2023 - Debunking the claim - he has many Smart Meter videos.
http://www.ekmmetering.com
- self installed utility meters
Back to PRC68, Products for Sale, Military Utility Poles
[an error occurred while processing this directive] page created 8 July 2011.